How Race Plays a Major Role in NYC High School Admissions Game
My daughter just started her seventh grade in middle school. This is the year that counts for high school admissions. New York City’s school system is too complex for a middle-schooler to navigate on her own, so I began researching it. Rather quickly I discovered that what makes it so complex is race. However, most New Yorkers don’t think of race as the cause of this complexity. Their behavioral pattern is analogous to that of sifting through the banner ads to get to the content we want on the web. Most of us have gotten so used to ignoring banner ads that we hardly notice them. Separating what we want from what we don’t want has become second nature. This is how New Yorkers navigate the racial diversity, or rather segregation; the problem is invisible, like the banner ads.
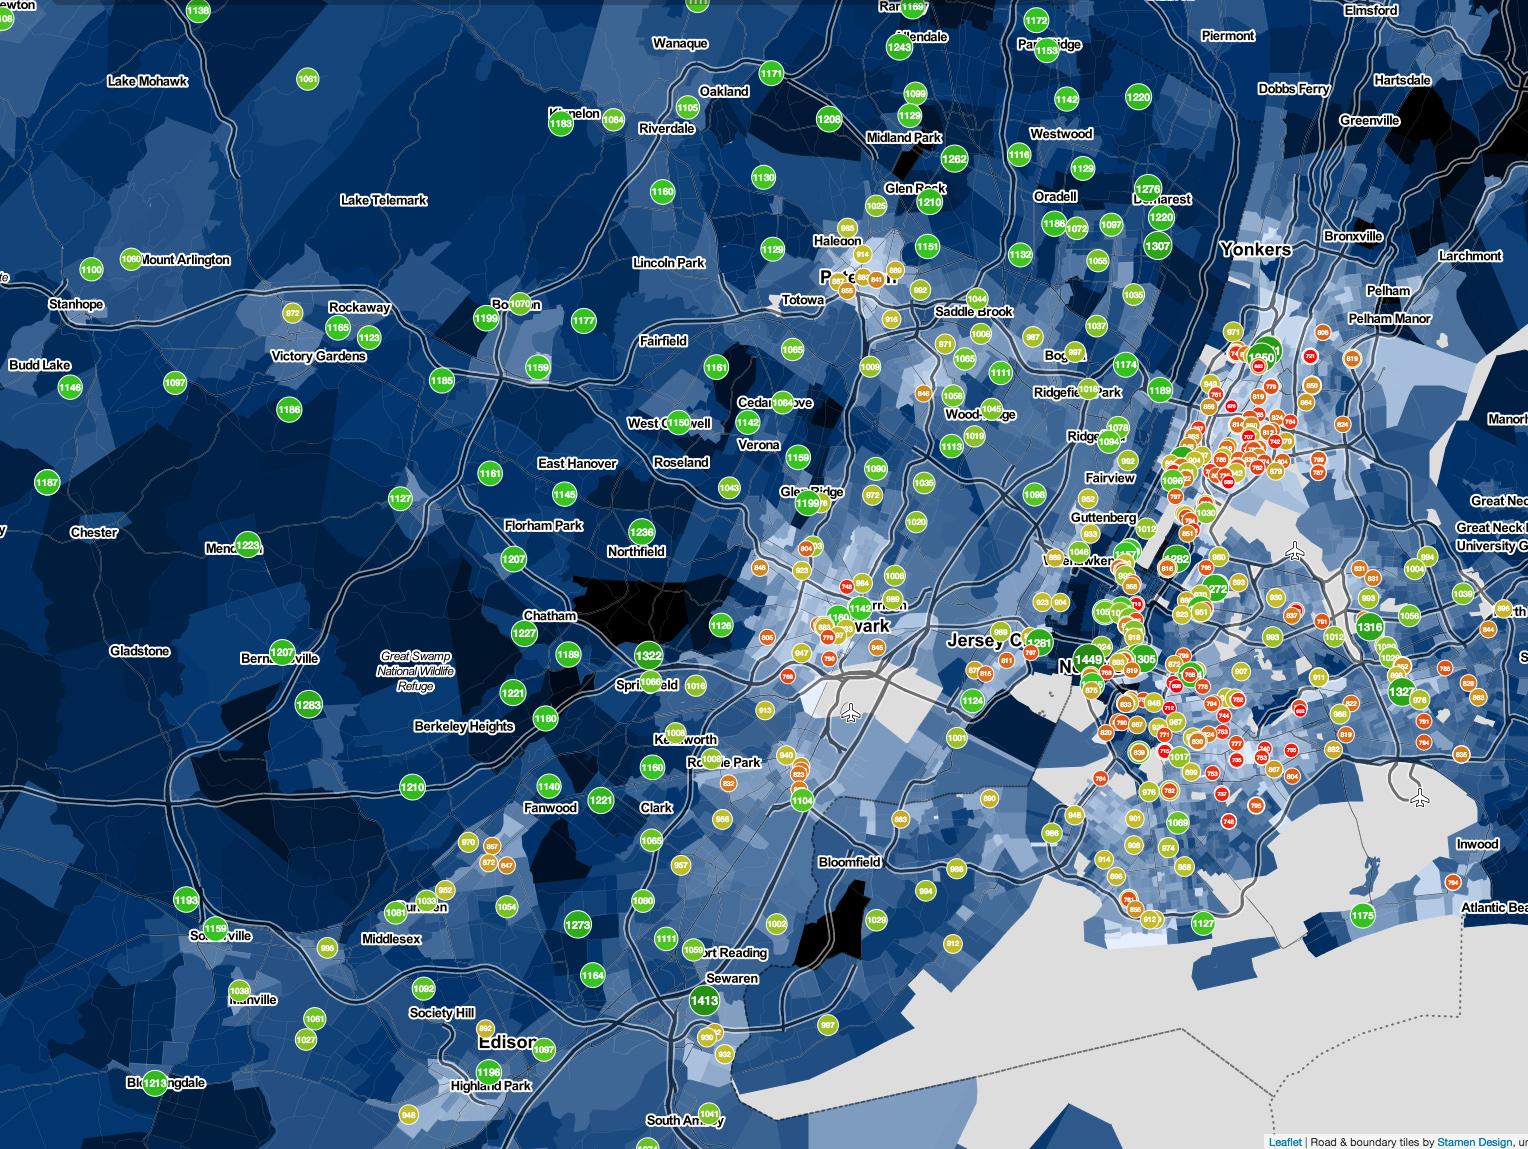
The map below is from EdGap.org. It is a map of high schools where green means high SAT score. As the scores move lower, they turn orange-ish, and red-ish at the lowest levels. The green schools are the so-called “competitive” schools in New York City, but as you can see, the green schools are just your normal neighborhood schools if you move to the suburbs. (Note: you can click on any of the images below to enlarge.)
This map also shows the income levels. The darker the areas, the richer. The lighter the areas, the poorer. The point of EdGap.org is to show the correlation between income and education. But income level is also closely tied to race. See the map below:
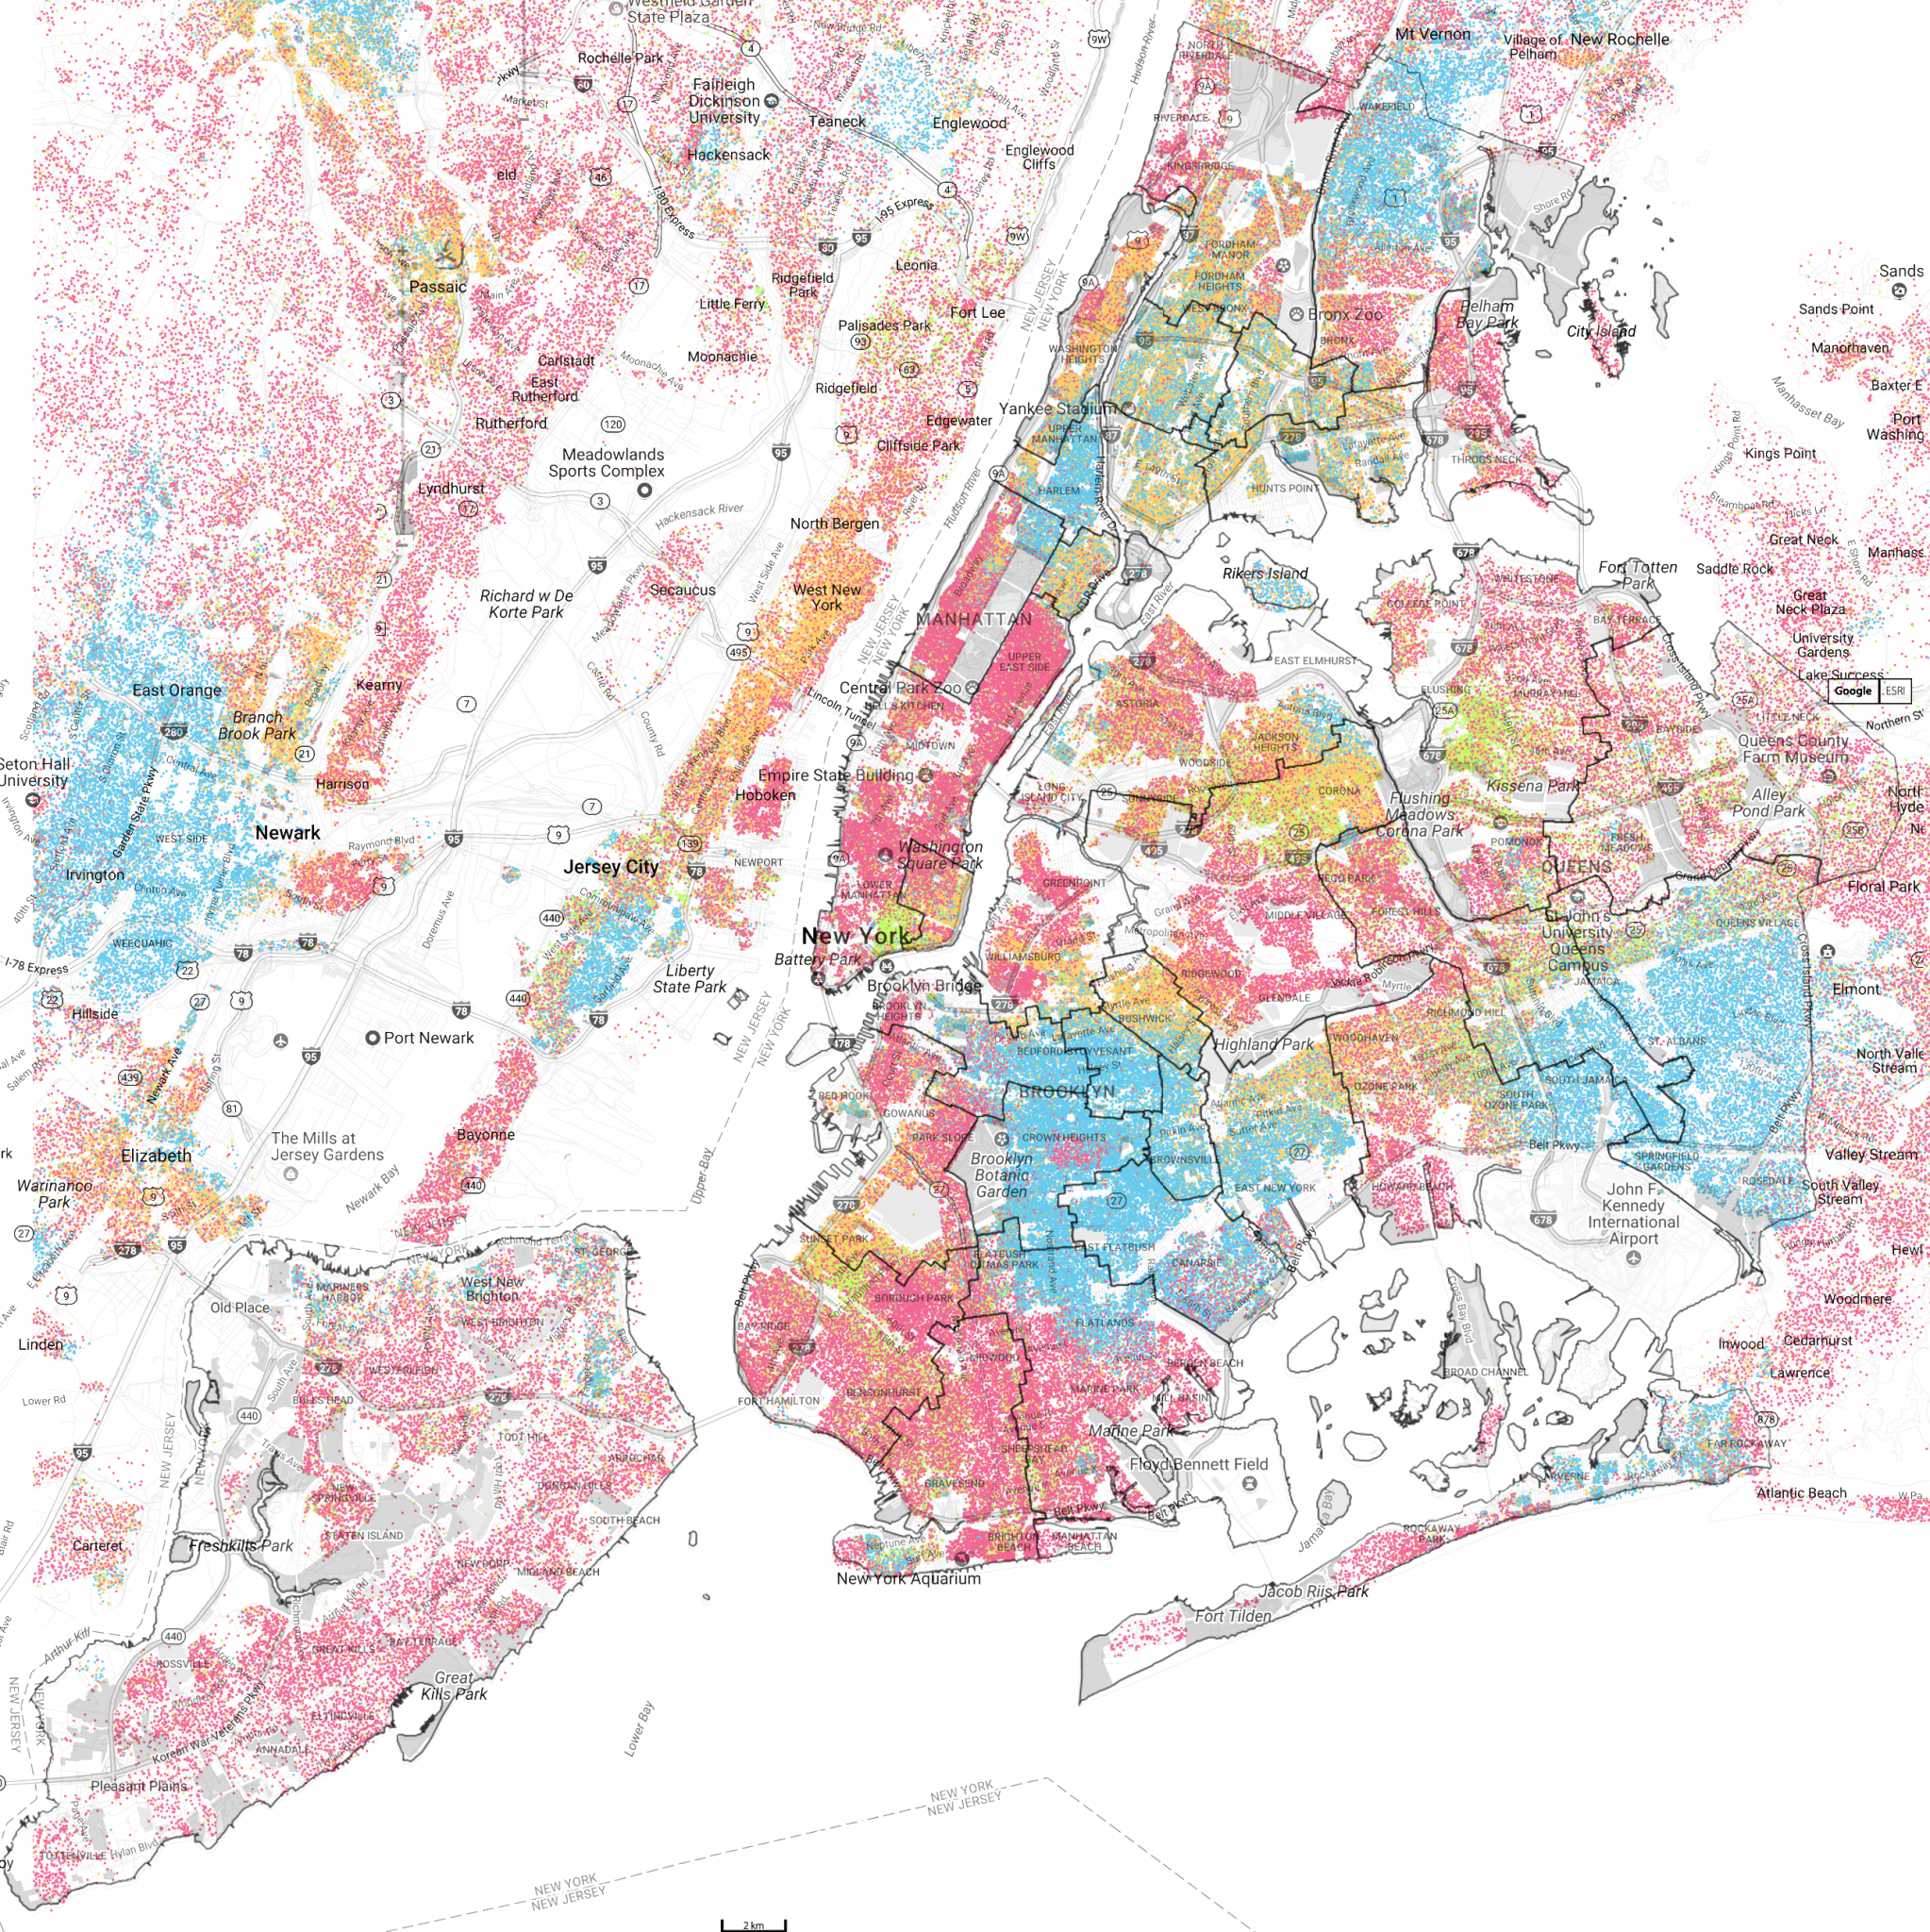
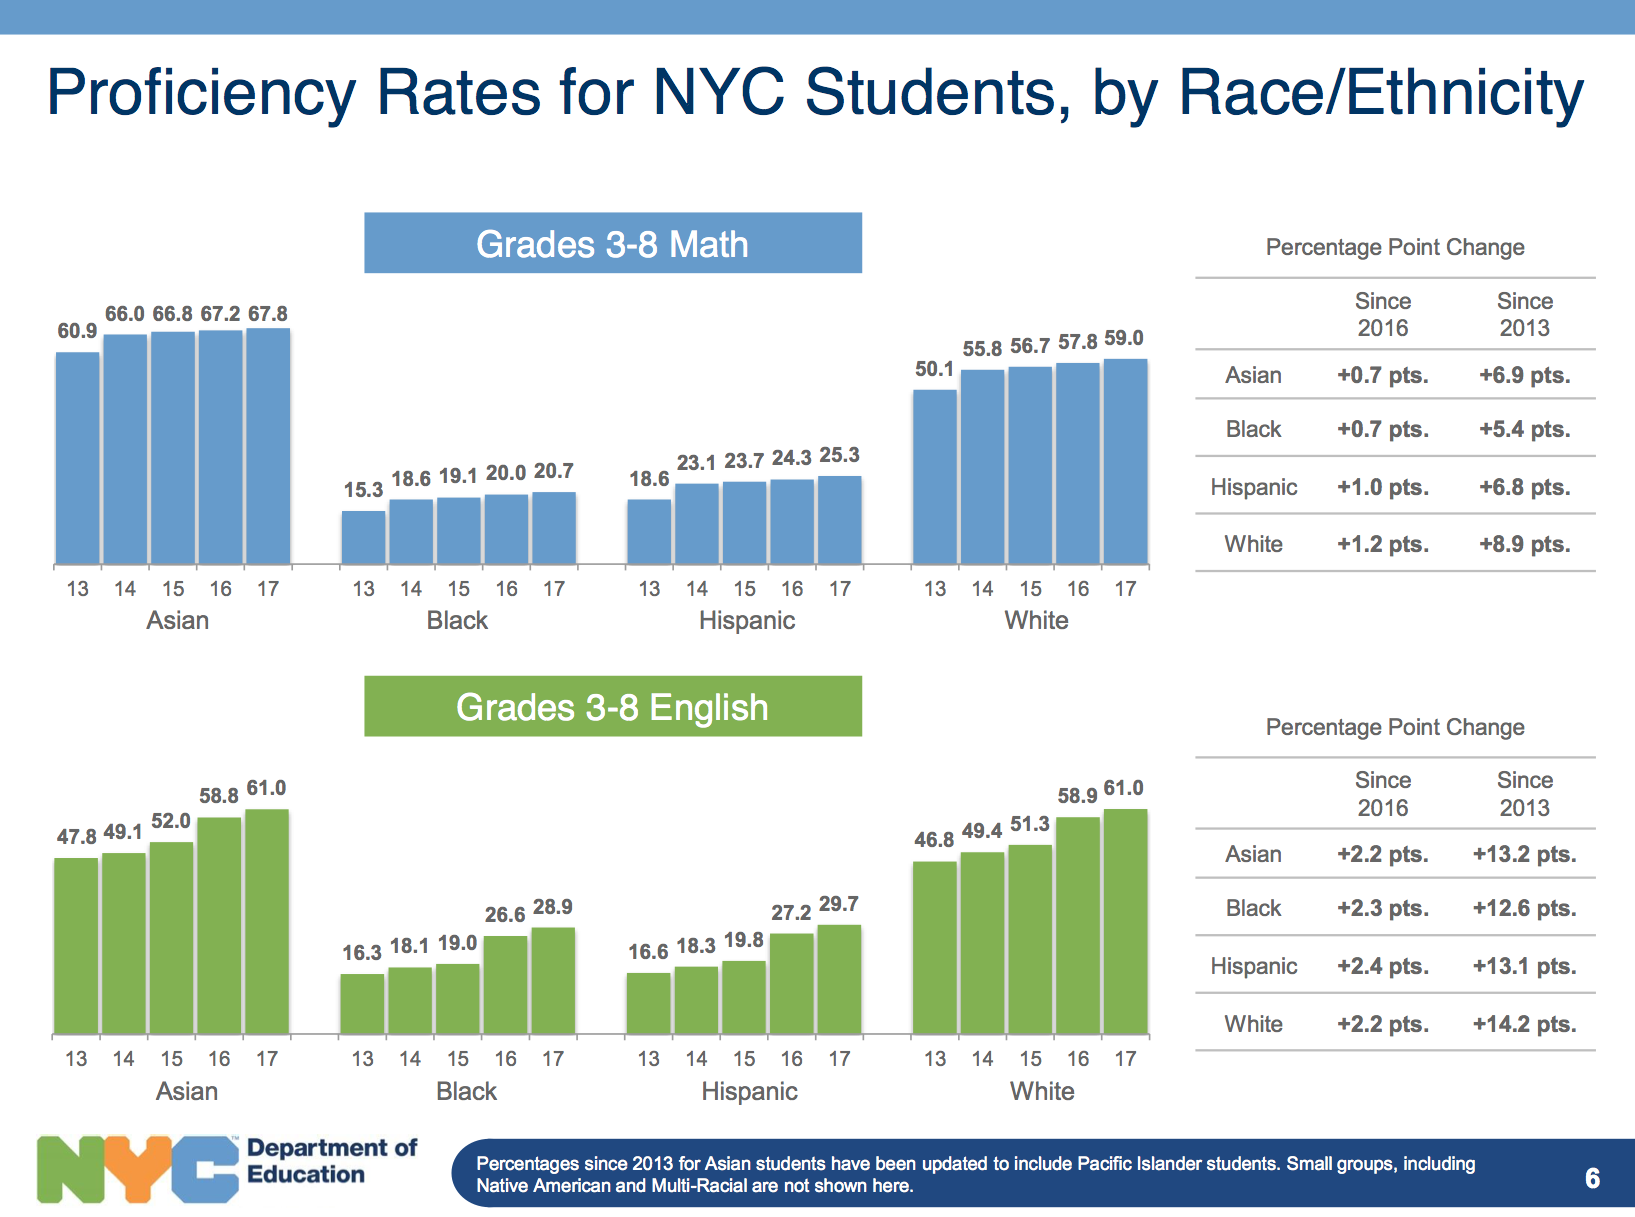
In this map, red is white, blue is black, orange is Hispanic, and green is Asian. Black lines demarcate the school districts. If you compare the two maps above, you can see that the low SAT scores correspond to where blacks and Hispanics live. This problem could not be more obvious in this official presentation by NYC Department of Education. As you can see in the slide below, the proficiency of blacks and Hispanics are half of the proficiency of whites and Asians.
Although income and race are closely intertwined, income inequality alone cannot explain this huge gap. The following is from the book, “No Excuses: Closing the Racial Gap in Learning” by Stephan Thernstrom and Abigail Thernstrom:
Asian students outperform others when the influence of social-class differences is eliminated from the equation. Laurence Steinberg studied 20,000 students in nine high schools in California and Wisconsin in the 1987–1990 school years. He found that Asian Americans did notably better than whites, just as whites did much better than black or Hispanic students, even when differences in social-class background were taken into account. The contrast between Asian and non-Asian students, Steinberg discovered, was sharper than that between poor and affluent children, between those with two parents and those with only one, and between any other groups defined along economic or demographic lines—remarkable findings.
Asians are throwing a monkey wrench everywhere. Here is another study where Asians are baffling the researcher. They discovered that Asian high school students are spending nearly two hours a day on homework while white and Hispanic students are spending half of that. Black students are spending only about a third. The study concluded: “these analyses of time use revealed a substantial gap in homework by race and by income group that could not be entirely explained by work, taking care of others, or parental education.”
I too have found specific examples of this monkey wrench in my research. I downloaded the latest Common Core test results, sorted the schools by the average scores, and discovered that the best middle school in New York City is Christa Mcauliffe School in Brooklyn which is located in a low-income neighborhood near Brooklyn’s Chinatown. The students are over 70% Asian. The relationship between the academic level of a school and the income level of its neighborhood should be more closely correlated for middle schools than for high schools because not many middle school students commute far. The high school data wouldn’t correlate as much because public transportation is highly developed in New York City.
If income was the key issue, Christa Mcauliffe School could not be the best middle school in New York City. 62% of their students are categorized as “economically disadvantaged” which means their income is low enough to qualify for free lunch. This directly contradicts the common theory that income is what determines academic success. Their performance is impressive. 92.4% of all students are in the top 25% of the state. Other top schools do not have such a large percentage of low-income students. At NEST+m, only 13% of students are “economically disadvantaged.” At The Anderson School, only 8%.
And, here is another interesting bit of data from Christa Mcauliffe: their low-income students on average achieved the same exact score (373) as the higher-income students. 90.2% of the low-income students are in “Level 4″ (top 25%) as compared to 89.3% for the higher-income students, slightly outperforming the latter.
So, how do they achieve it? The more compelling theory than income is culture. Here is another quote from the book “No Excuses”:
Weren’t Asian parents being unrealistic in demanding that their children always get A’s? Many Asian youths, they must have understood, are merely average or below average in their abilities. But Steinberg made a fascinating discovery: Asian parents and their children had a set of distinctive attitudes. They did not think in terms of innate ability. Nor did they see luck or teacher biases as playing a part in their grades. Academic success or failure did not (in their view) depend upon things “outside their personal control.” They believed instead that their academic performance depended almost entirely on how hard they worked; their performance was within their control. A grade below an A was evidence of insufficient effort.
This explains why the so-called “specialized high schools” in New York City are dominated by Asian students; because their admission is based solely on the test (SHSAT) result. Asians focus their effort on what can be controlled. This is a cultural difference.
In terms of race and subcultures, and their impact on education, my daughter’s school, Tompkins Square Middle School, is an interesting case study. The latest Common Core results indicate that their performance is exactly at the city average. Even the racial distribution of the school is very much in line with the city’s. 72% of students at Tompkins are “economically disadvantaged,” again, aligning almost perfectly with the citywide number of 71%. The Common Core results also align with the income theory, the low-income students scoring 300 (18% in Level 4) as opposed to 325 (25% in Level 4) for higher-income students.
My daughter often tells me stories that represent the different values of their cultures. Some students, for instance, brag about low grades and cheating on homework. Apparently, there is a certain cool factor associated with low academic achievement among some students. But I also hear stories representing cultures that value academic achievement.
This is why I argue that race is the key factor; when parents and students are navigating the high school system in New York City, they are navigating the cultures closely associated with race. Without the concept of race, we wouldn’t even know what to call these cultural differences. If academic standard alone were the criteria, whites and Asians wouldn’t be segregated, and neither would blacks and Hispanics because they are roughly at the same levels. According to a study from UCLA’s Civil Rights Project, New York City has the most racially segregated school system in the country. After all these years, it has become second nature for New Yorkers to navigate through the reality of segregation. In the charts below, we can see how they are segregated.
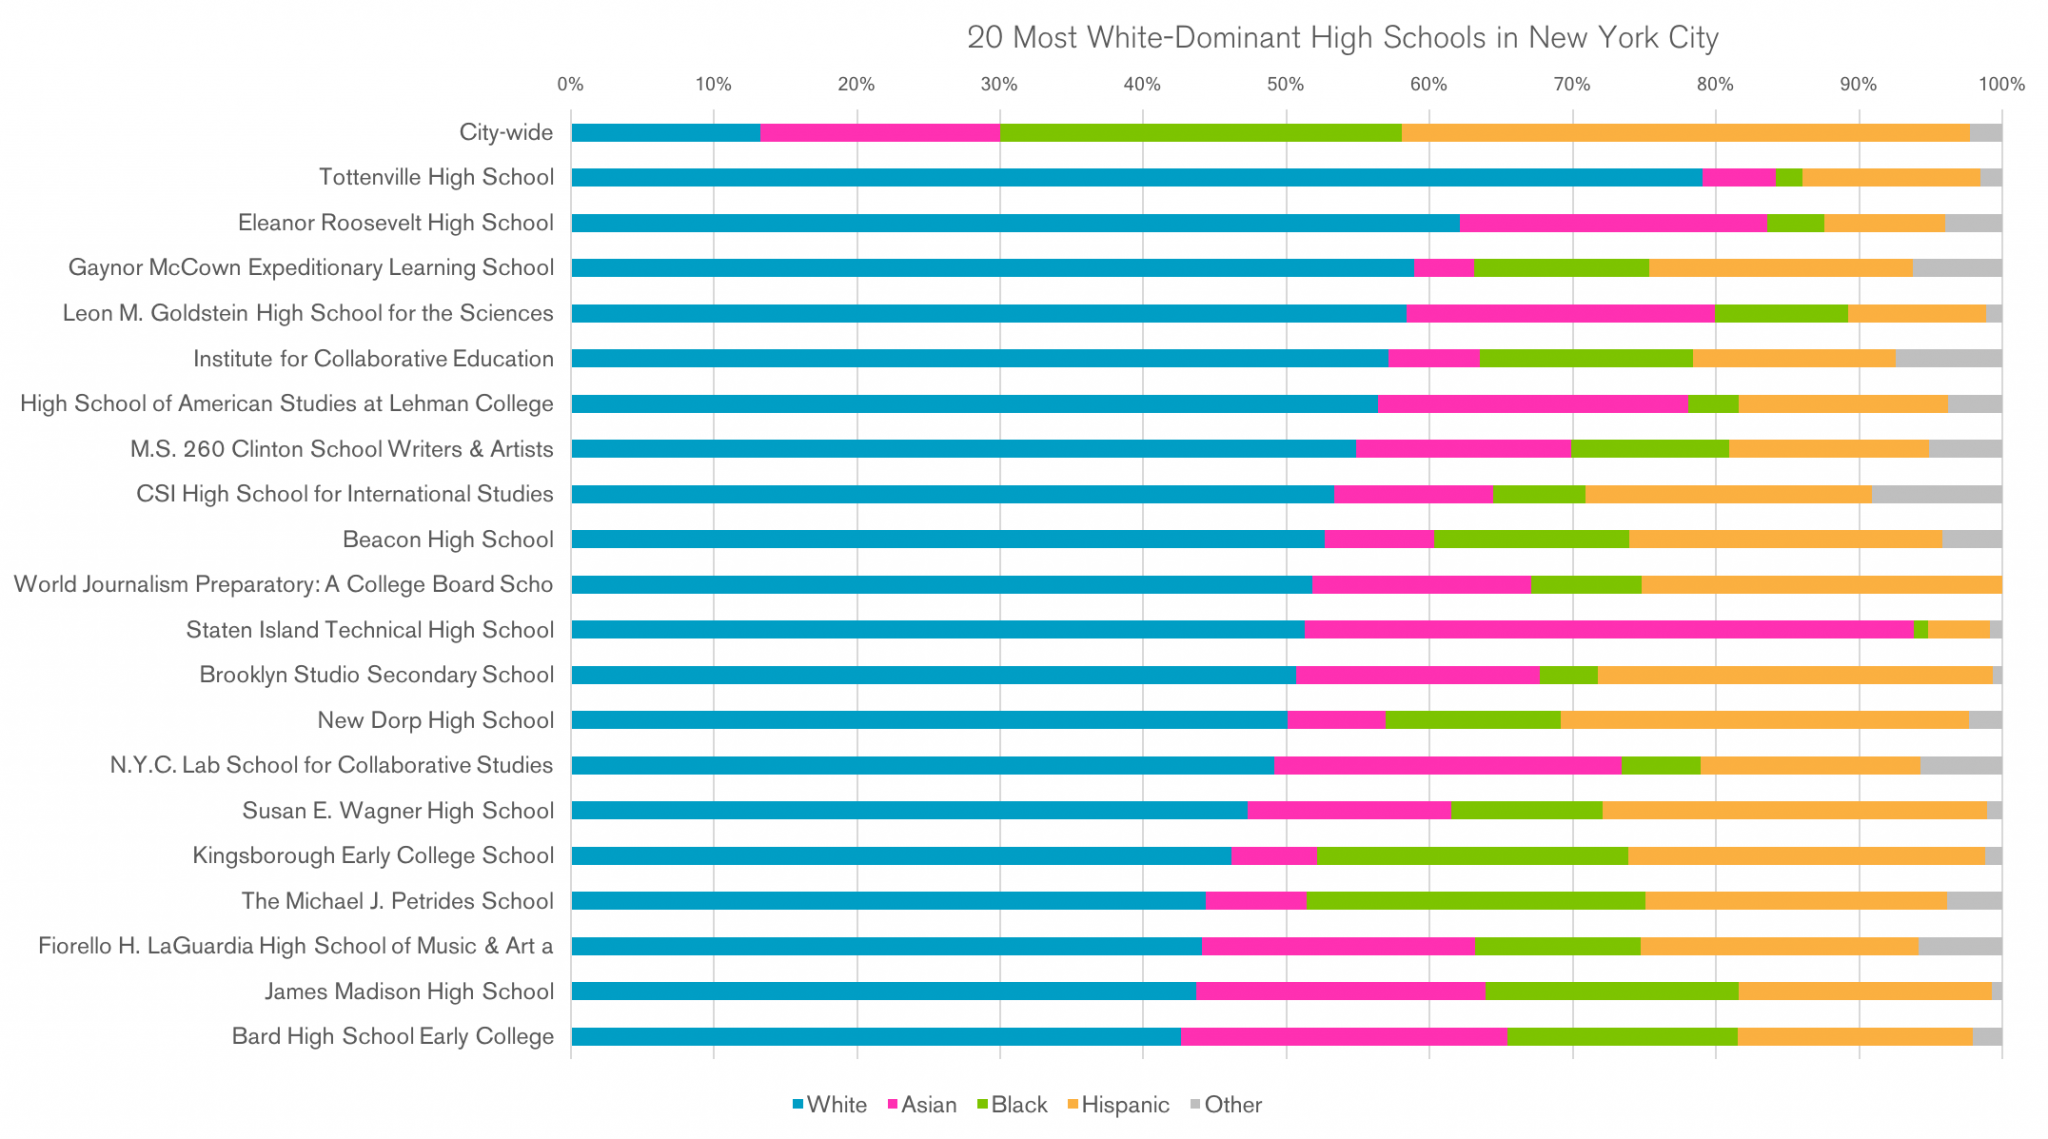
The chart below is the 20 most white-dominant schools in New York City (out of about 500 schools):
The first line shows the distribution of the whole city, so we can see how skewed these schools are. The reason for some of them is that they are in Staten Island which is predominantly white and the students in other boroughs are not likely to commute there since they are on an island.
Some are predominantly white because their academic standards are high, but if that were the only criteria (i.e. pure meritocracy) the Asian percentage should also increase proportionately. If we look again at the slide presentation by Department of Education above, we can see how easy it would be for a school to select only whites and Asians; simply put the cut-off point for academic requirements high enough. But at the top 20 whitest schools, this is not what is happening.
Take a look at ICE, Beacon, and Kingsborough; their Asian proportions are smaller than that of the whole city. How can they select white students without selecting Asians? What these three schools have in common is interview. Since interviews are subjective, white people can exercise their power to maintain their dominance. One person online described Beacon as, “It’s like a private school.” This description makes sense because high tuition is also an effective way to select mostly white students while suppressing the number of Asian students.
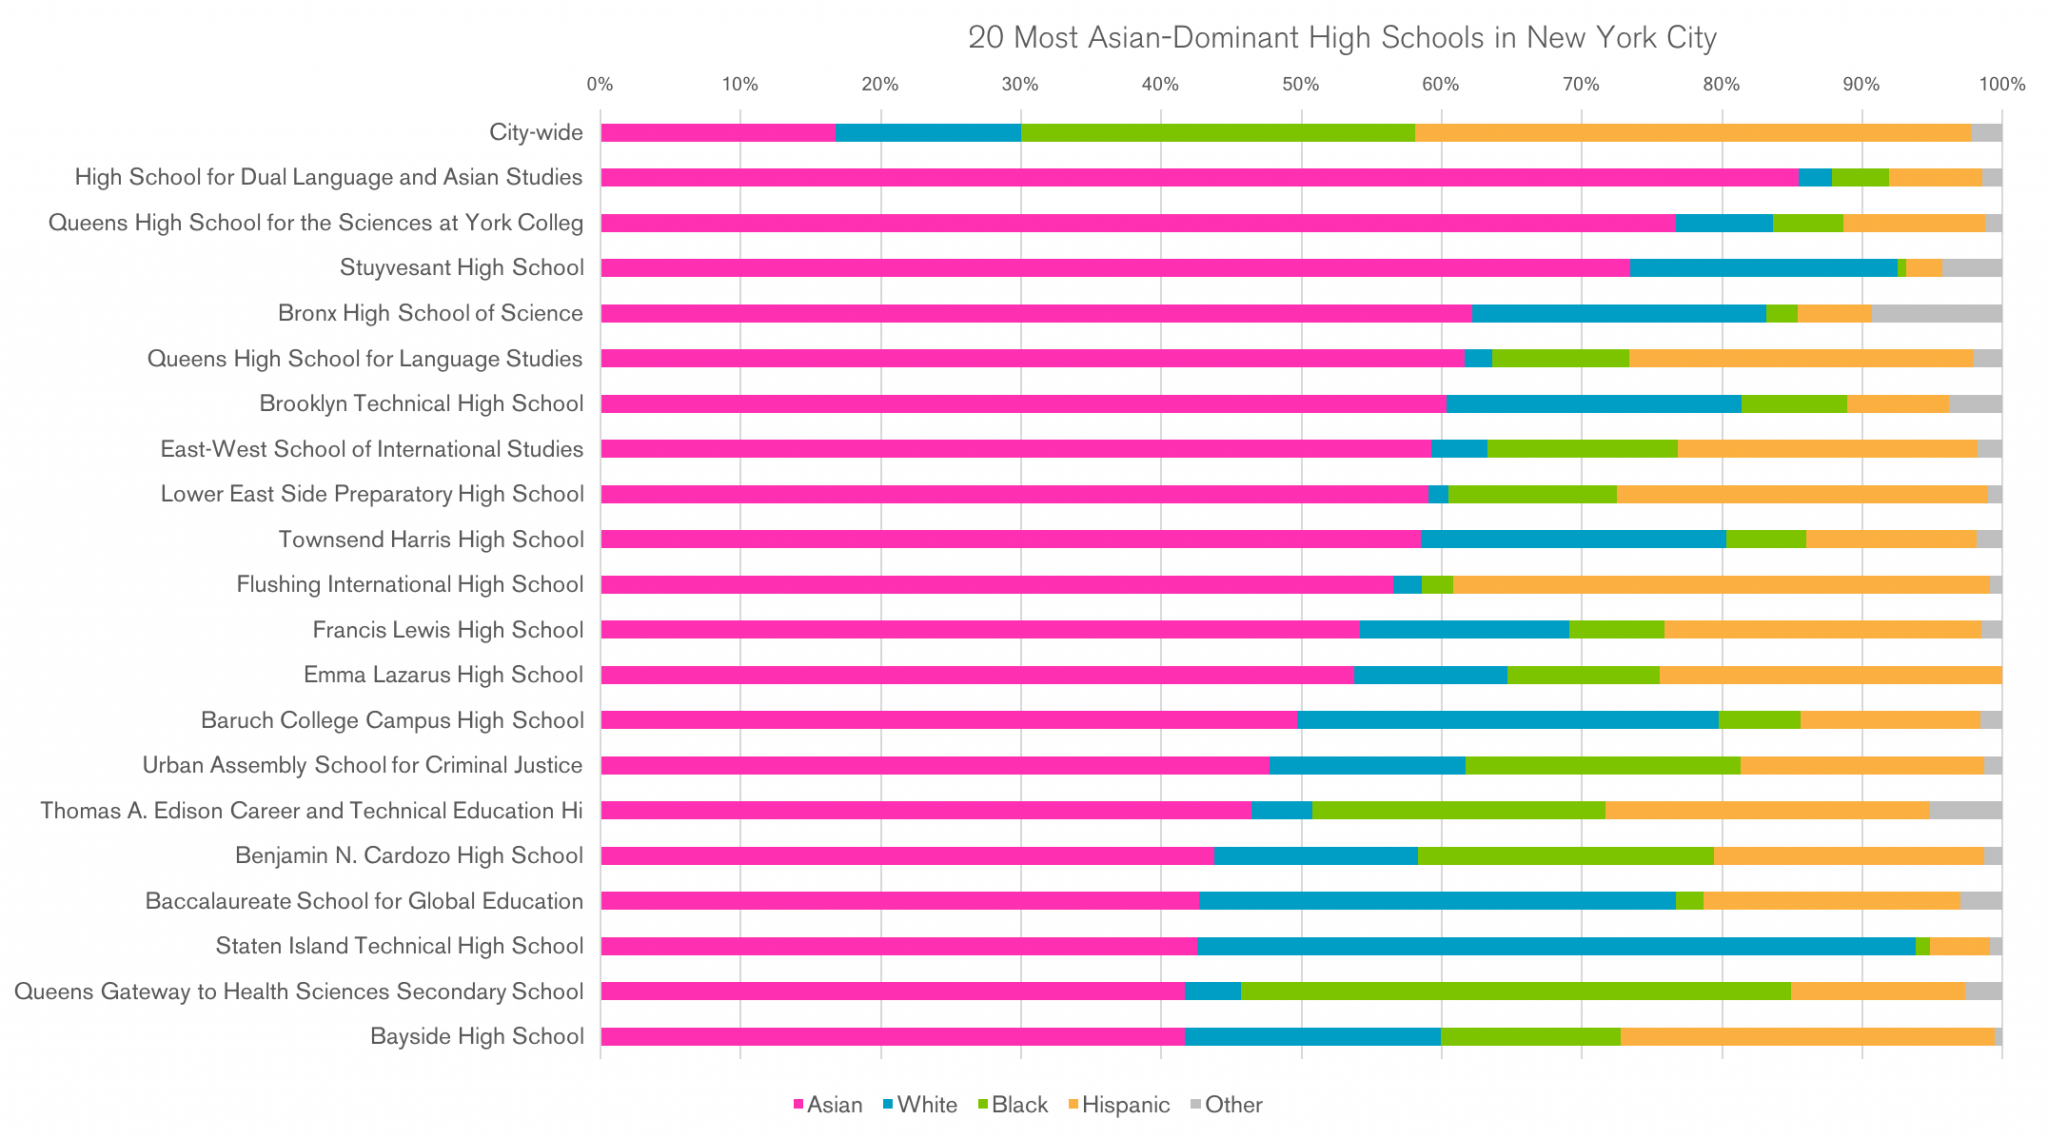
The chart below is the 20 most Asian-dominant high schools in New York City:
What is noteworthy here is that five out of eight SHSAT high schools are in this top 20. Seven of them are in top 30. Clearly, Asians love tests. This supports the theory in “No Excuses”; they focus their efforts on what they can control.
But the same can be said for whites too. Because they are the most powerful and well-connected race, they can indeed control who get into the most desirable schools by other non-meritocratic means like interviews. The difference is that their children don’t need to work as hard. In my personal observation, White parents do emphasize personal connections, making friends with the right people, which is one of the reasons why they like sending their kids to prestigious private schools. By emphasizing personal connections, they are maximizing their advantage as the dominant race in this country. Asians do not have this advantage in the US, so, they have no choice but to focus on measurable standards like tests.
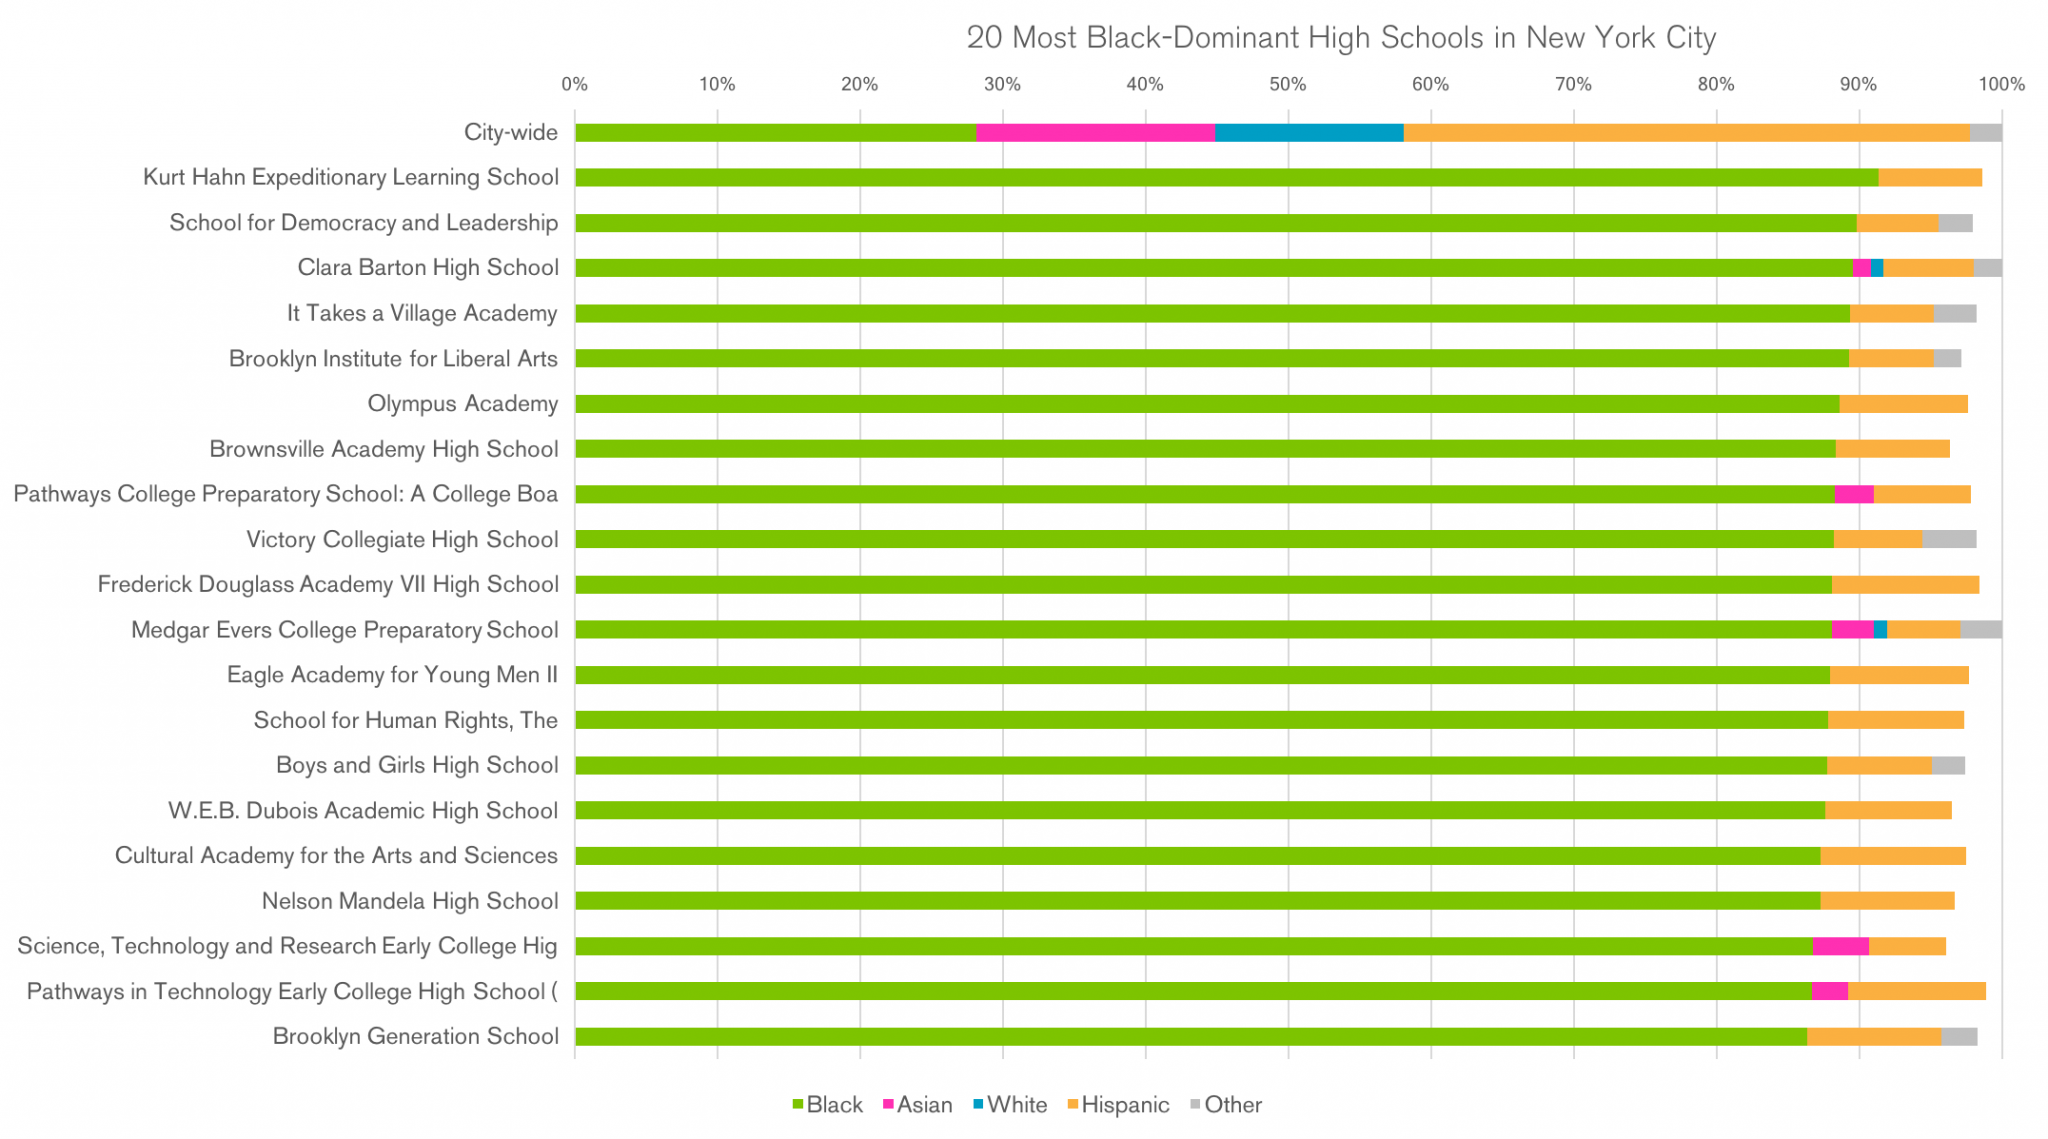
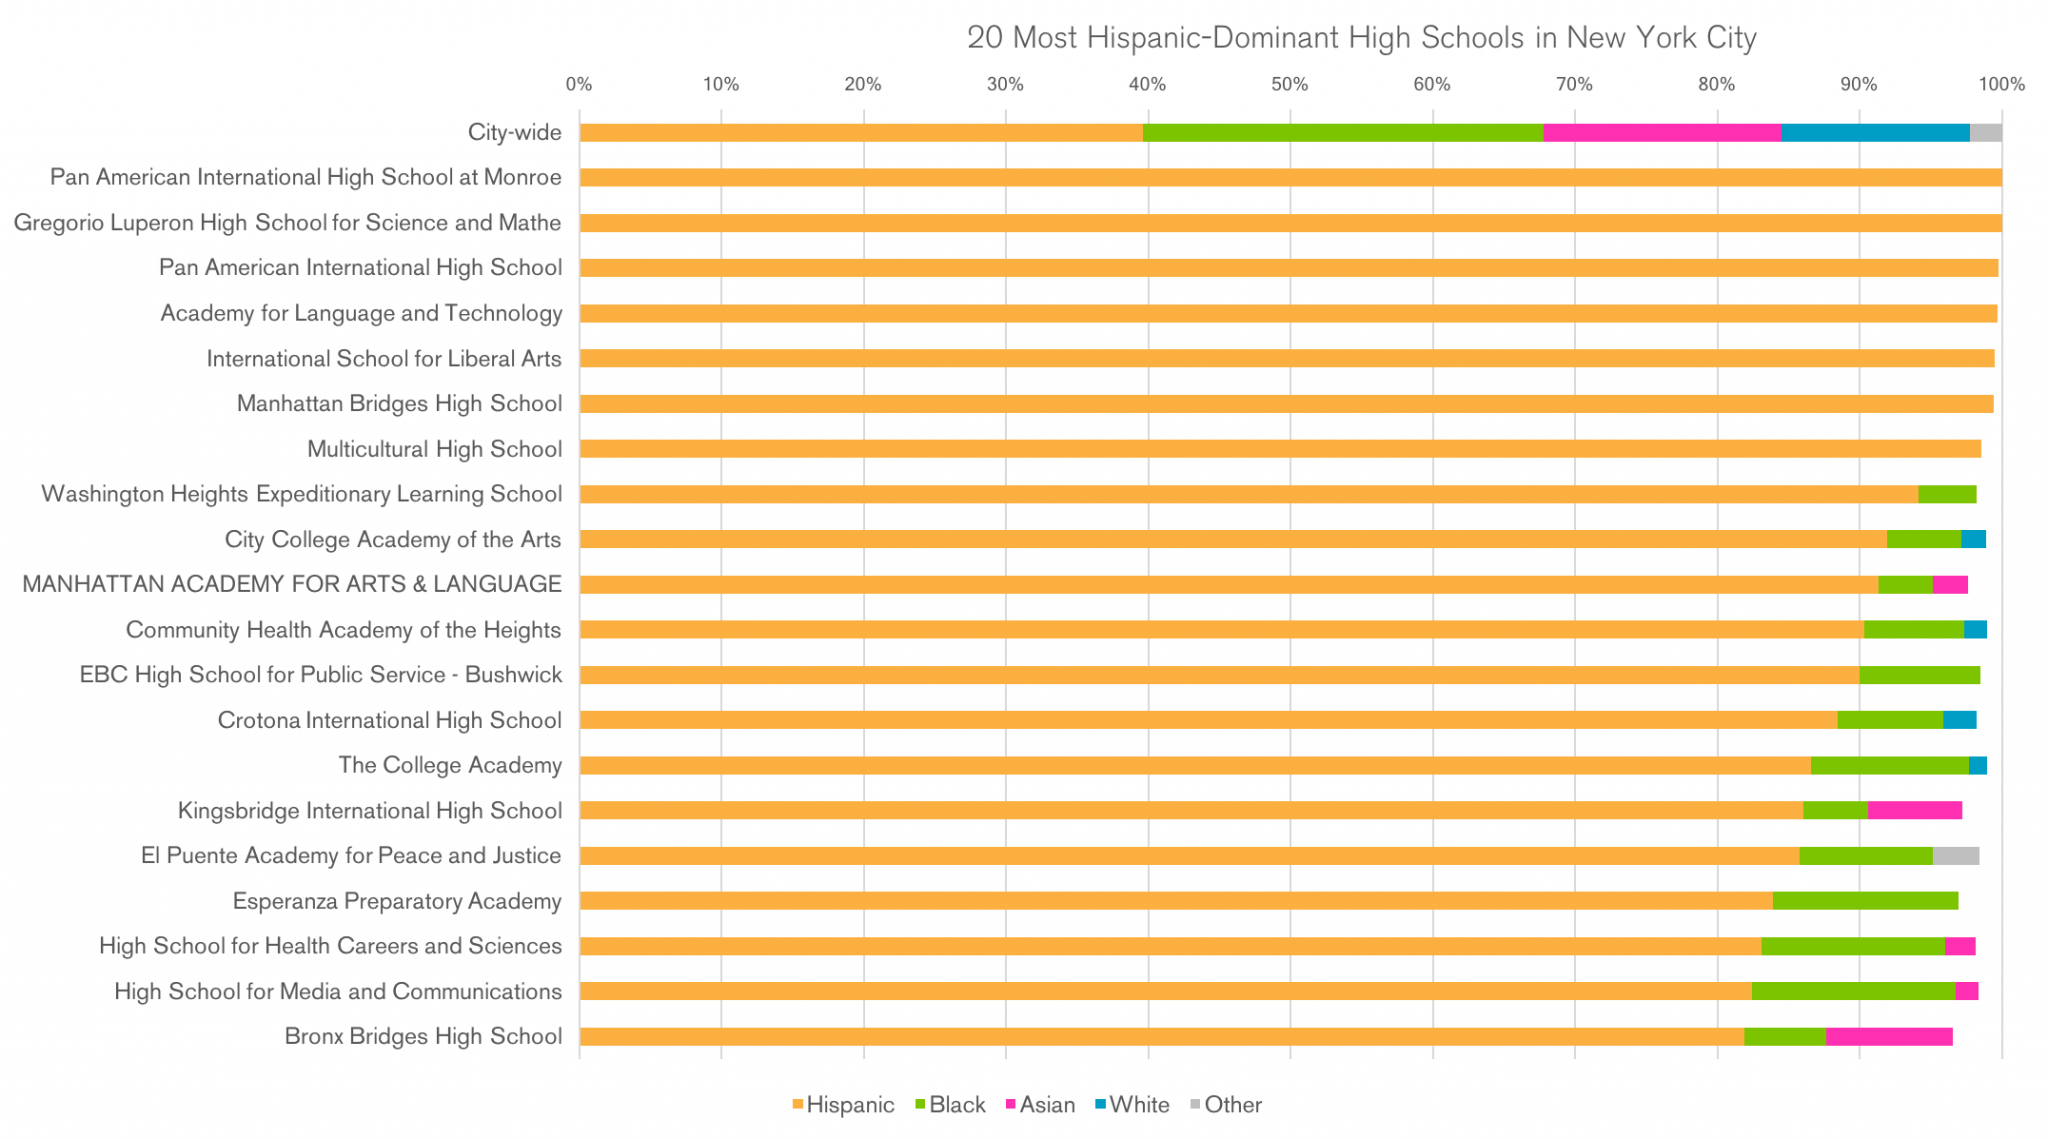
The charts below are for blacks and Hispanics:
What immediately jumps out is that they are much more segregated than the Asian- and white-dominant schools. Over 80% of the students are blacks or Hispanics. Given that their academic levels and income levels are similar, the segregation between blacks and Hispanics are not based on either of those factors. I think it’s safe to say it’s a cultural divide.
Many parents and students, regardless of race, are trying to avoid schools where they would become a cultural minority. The parents in particular do not want their children to attend a school where their voices would not be heard because the dominant cultural values of the school would bulldoze over theirs. White parents, for instance, may discourage their children from attending Asian dominant schools no matter how excellent they are academically. Many white parents I know are concerned that Asian focus on tests at schools like Stuyvesant would deprive their children of normal life. But, for many Asian parents, such a concern is a luxury they do not have, since Asians are often discriminated against as they climb the corporate ladder because of their lack of connections to those in power (so-called “bamboo ceiling”). They have to make up for it in other ways.
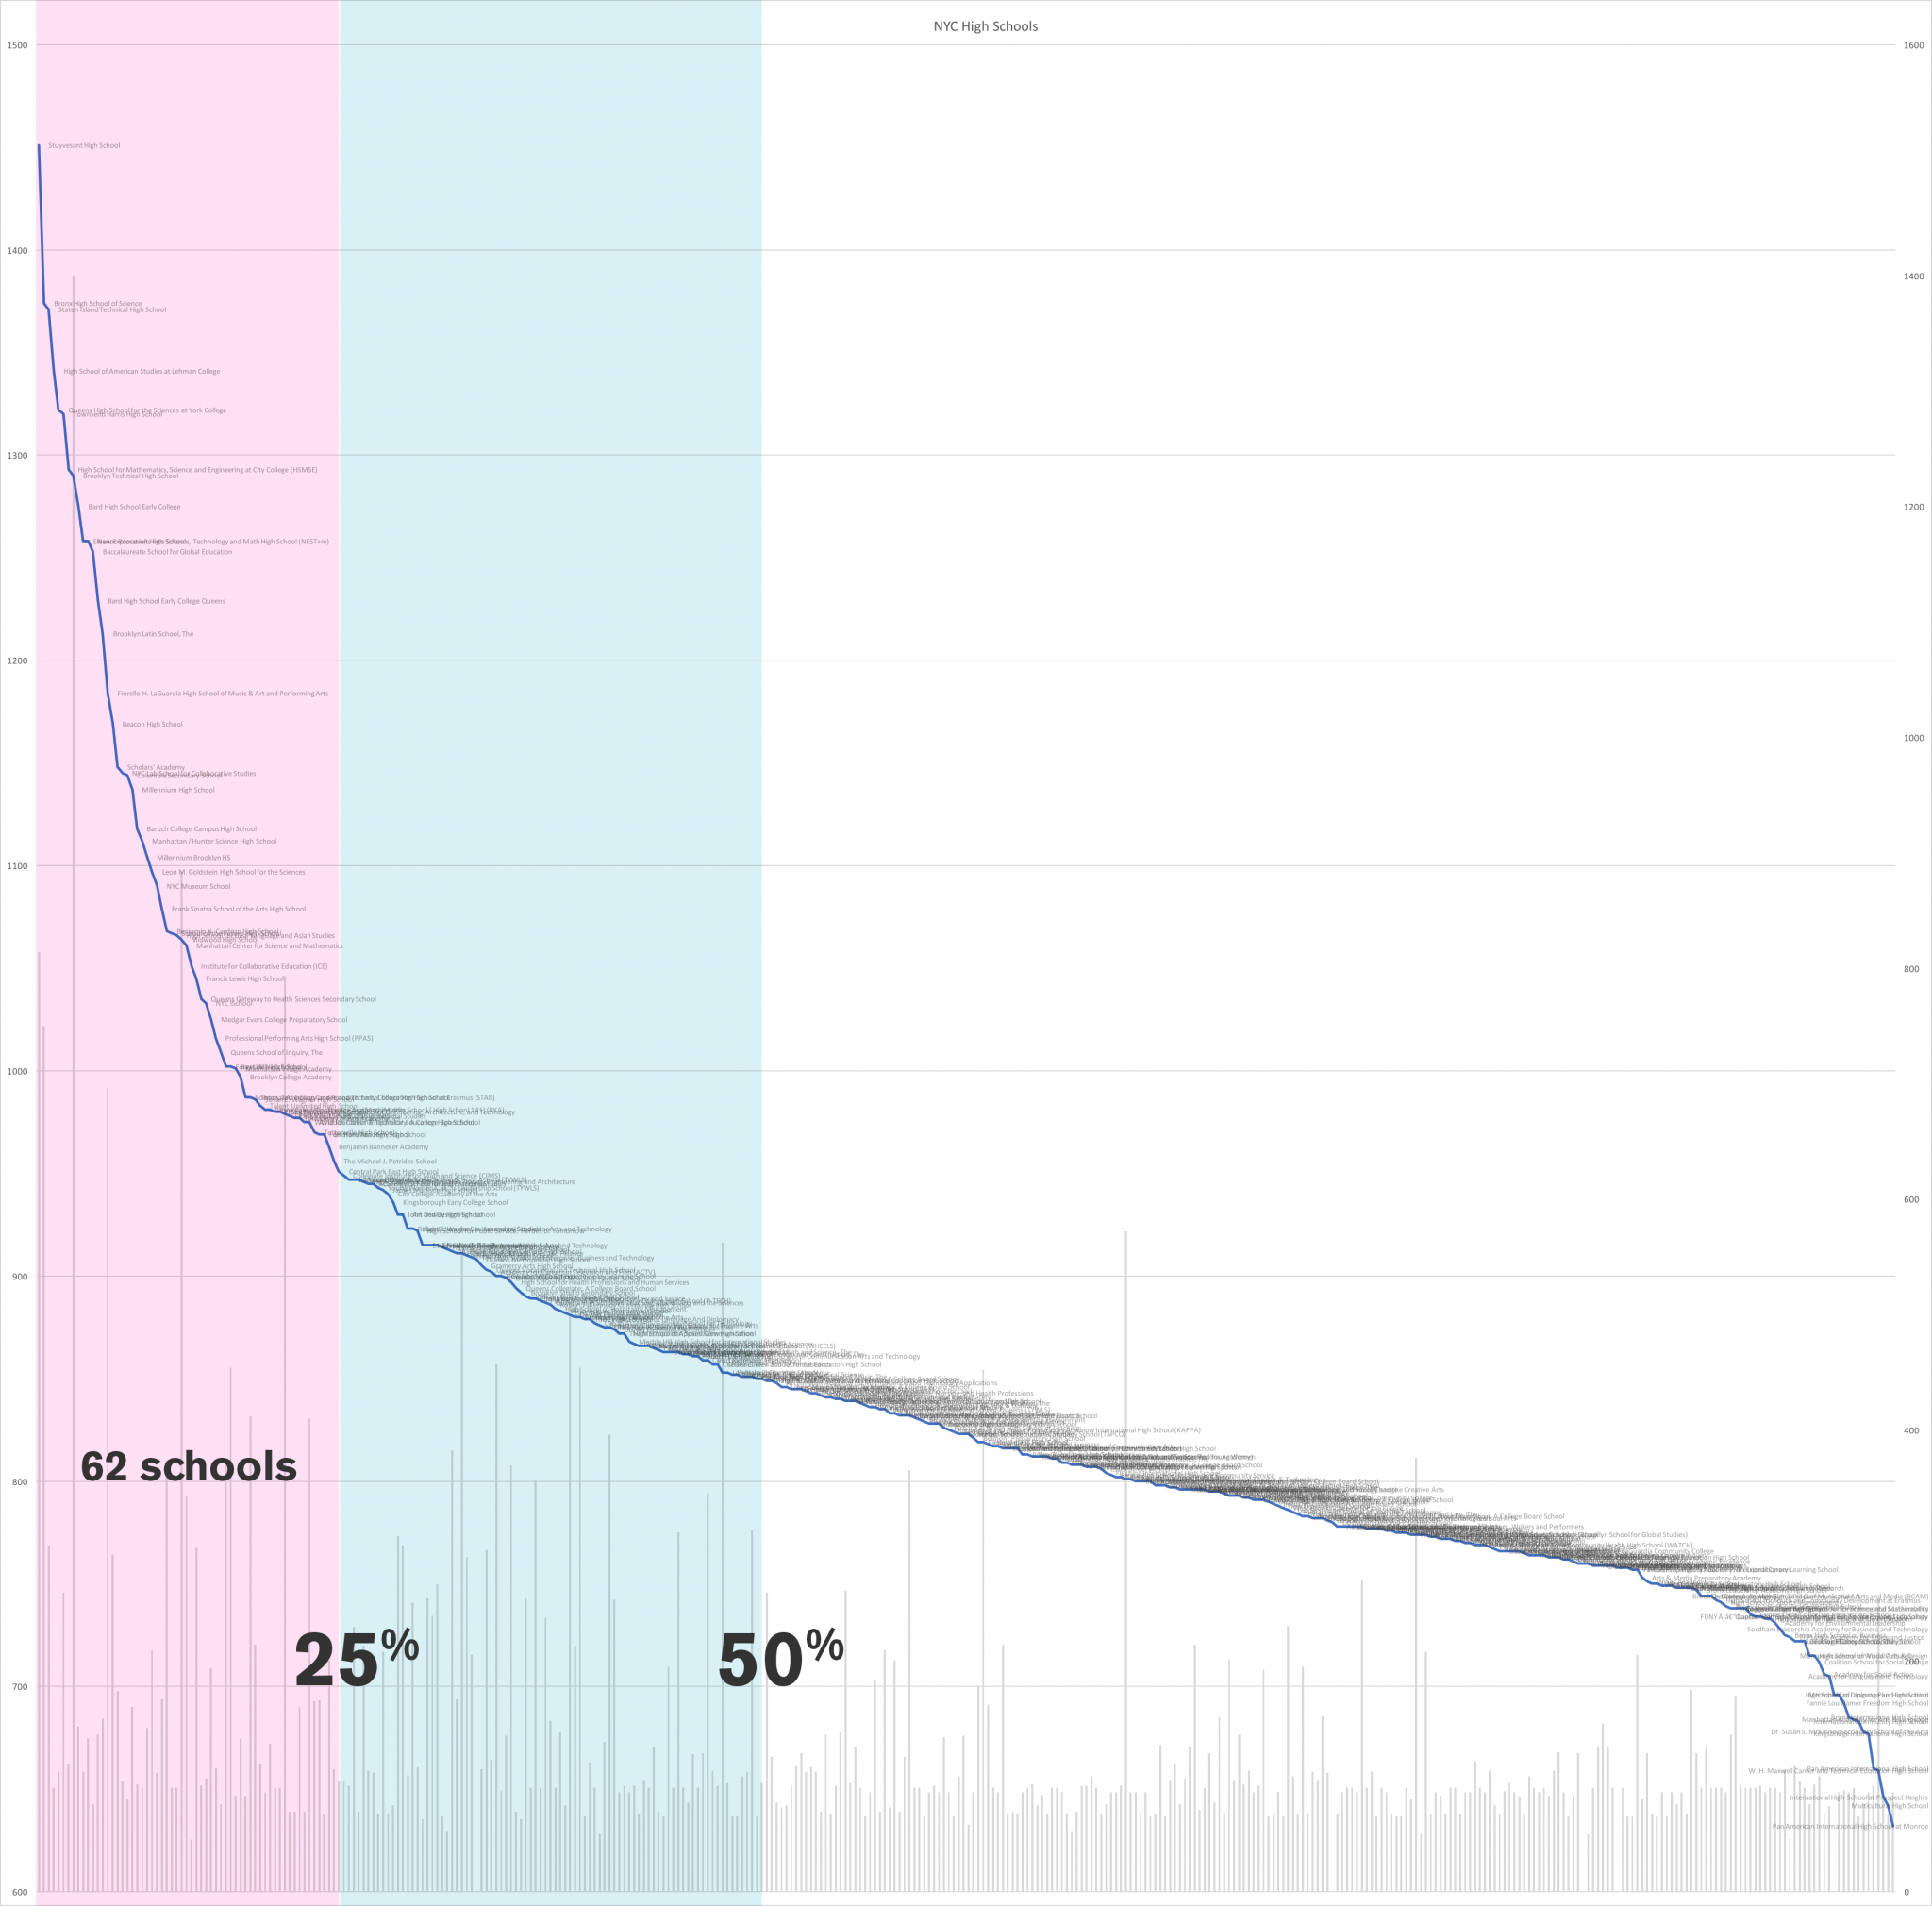
For those parents whose cultures value college education, there aren’t many schools in New York City. The concern is more about avoiding bad schools than about getting into the best ones because there are so many bad schools. In the chart below, I’ve placed all the high schools horizontally in the order of average SAT scores. The vertical axis is the SAT score, math and reading combined.
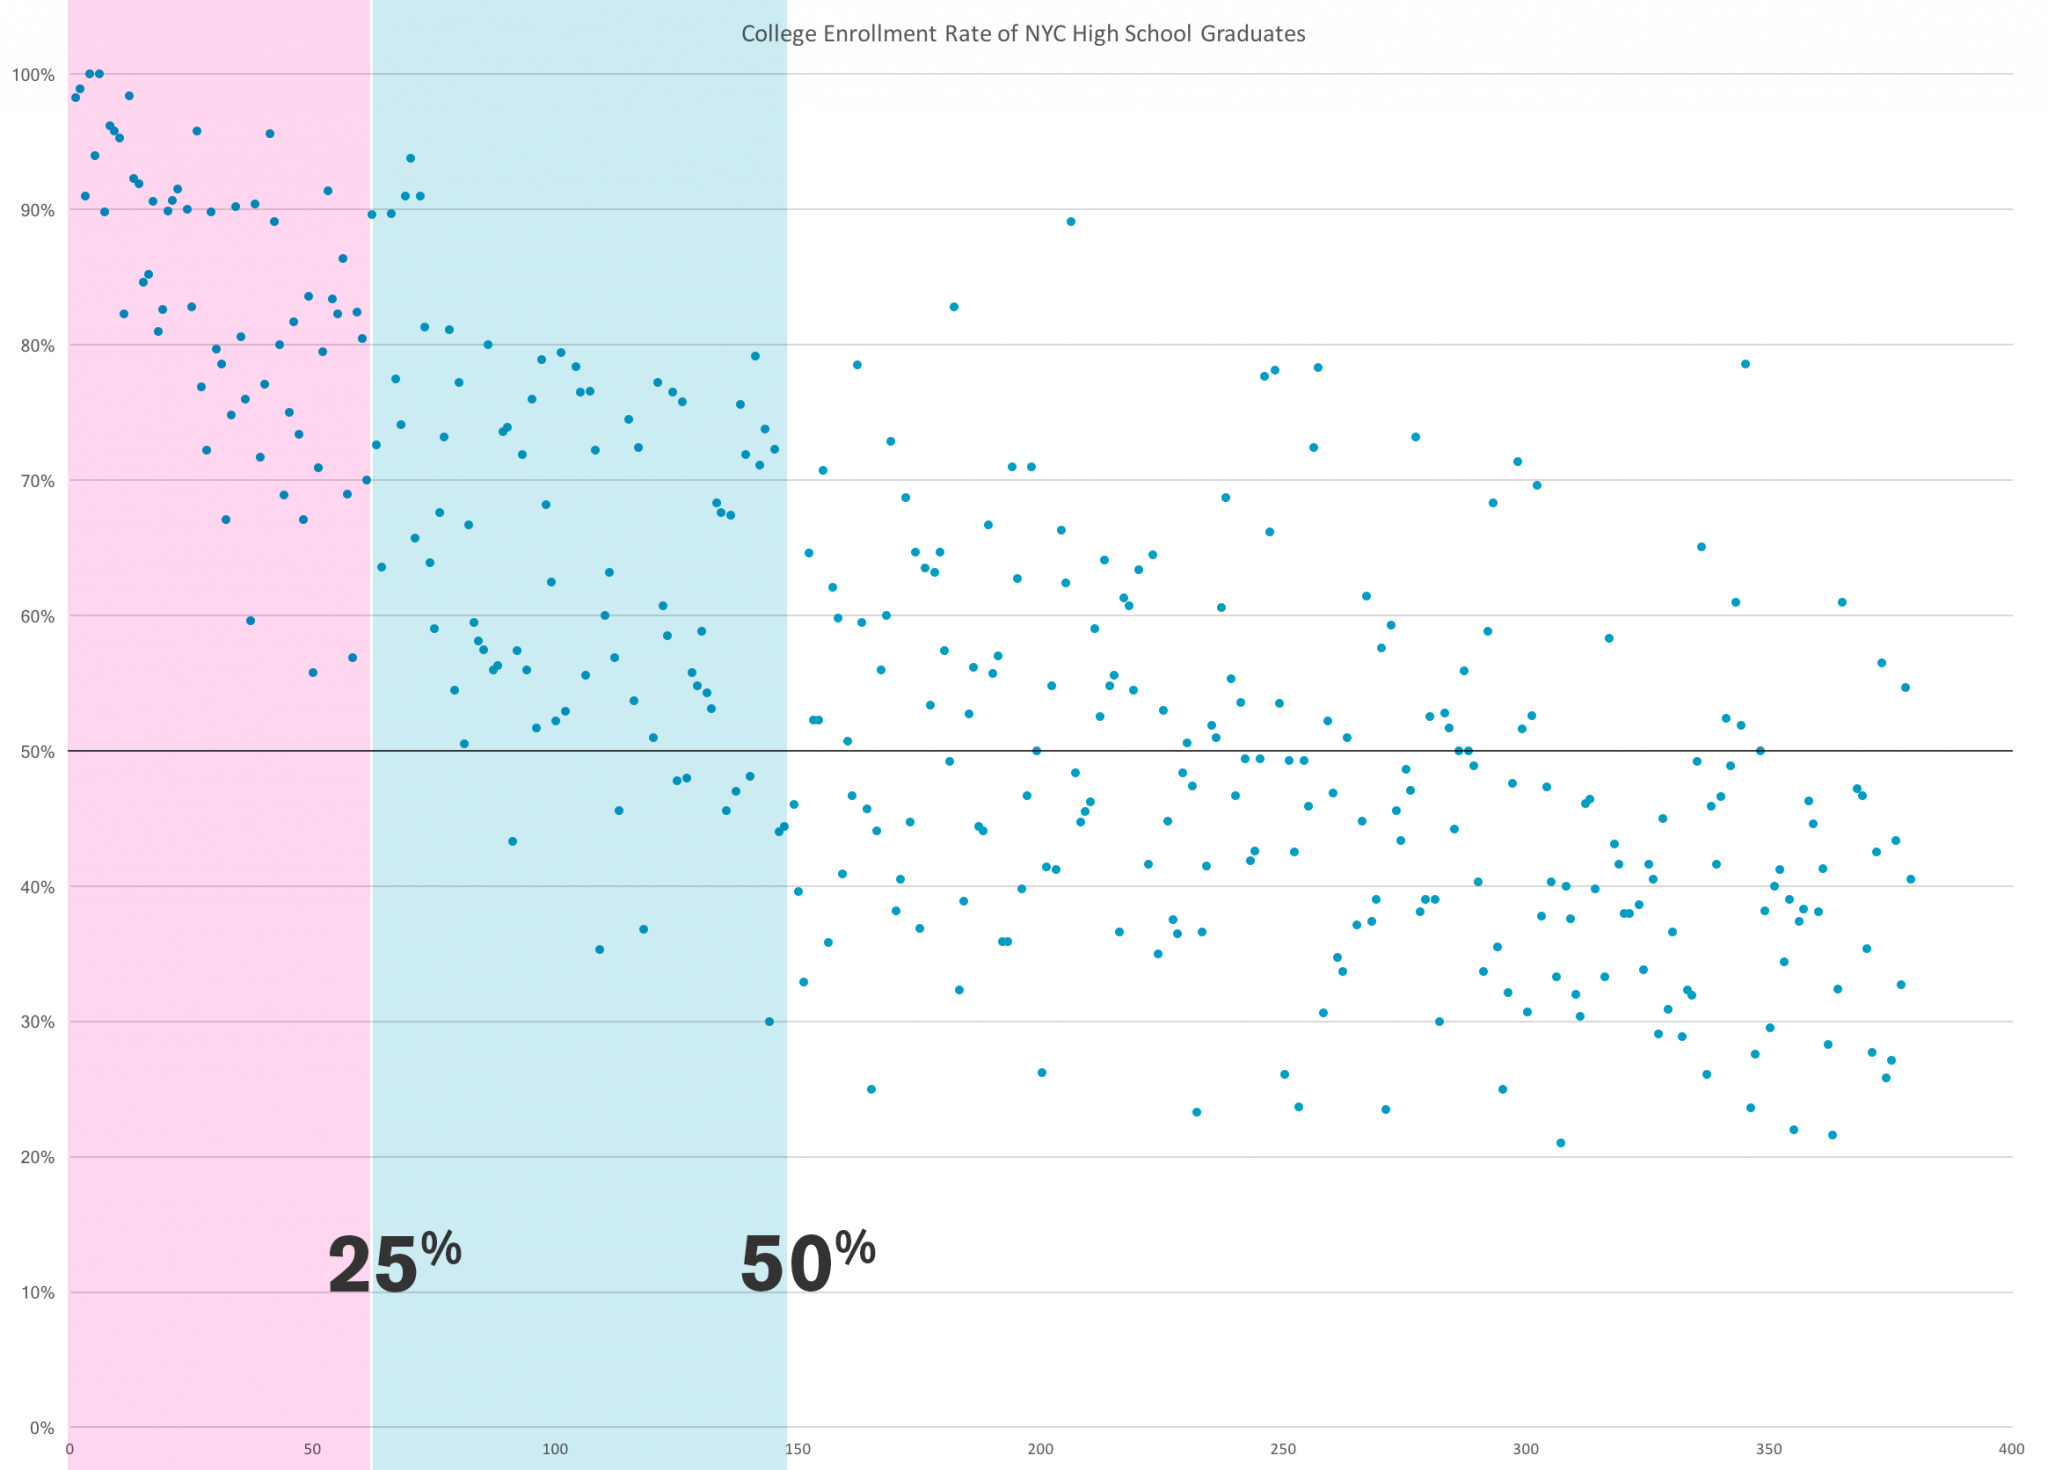
The city is obviously trying to squeeze as many students as they can into the top schools, so 25% of all students attend the top 62 schools. There are roughly 500 high schools in New York City, but if you care to send your kids to college, anything below the 25% line is risky. Here is why:
Horizontal axis remains the same but the vertical axis here is the percentage of students who went to college. (To be more precise, this is how DOE describes it: “graduated from high school and enrolled in college or other postsecondary program within 6 months.”) The thicker horizontal line is at 50%, that is, only half of the students go to college. If you are serious about your child going to college, you wouldn’t want to send them to a high school where it’s normal for only half of the students to go to college. So, again, you would want to aim for the schools in the top 25%. In the first map I presented, these are the green schools; they have the average SAT score of 950 and above. In the suburbs, green schools are the norm, so you wouldn’t have to worry much. In New York City, the majority aren’t.
And, here, we are not talking about pushing our kids to go to Ivy League schools; we are talking about sending them to any college. Let’s take CUNYs as reference points. The average SAT score of Baruch freshman was 1,280. Brooklyn College was 1,170. Hunter was 1,200. Here are the numbers of SUNYs. SUNY Albany is 1,085. Buffalo is 1,160. New Paltz is 1,117. Purchase is 1,070. Binghamton is 1,306.
The last high school to make it above the 25% line in my chart above was Central Park East High School at an average of 951. According to some reports, the two-thirds of NYC high school students are not college-ready. So, even if they make it to college, it doesn’t mean they can graduate.
If you want your child to go to college, there are roughly 60 schools to choose from but as soon as we take into account other factors, this number dramatically shrinks again. I have created a web tool to get a sense of what your options are. If you enter your address, distance your child is willing to travel, and the school district you live in, it will show you the schools you can consider applying. It grays out schools that are too far, only accept a few 9th graders, or mostly accept students who live in other districts or boroughs. For most people, more than half of the schools would be eliminated. Furthermore, some are highly specialized like performing art schools. You’d be lucky if there are 12 left to fill the application form.
Another factor that makes parents and students nervous is the matching algorithm DOE uses. For most people, this is a black box because it was invented by Nobel prize winning economists. It was intended to match students more efficiently with the schools, but because of its complexity, it didn’t reduce the level of anxiety. I had to exchange several emails with one of the economists, Alvin E. Roth, to fully understand how it works.
A common misunderstanding I came across online is that it works like the drawing of lottery balls. The algorithm would randomly select students and checks their first choices to see if the schools also have the students in their selections. If so, they are matched. This part is true enough, but the confusing part is what happens if the seats are filled before the algorithm processes all of the students’ first choices? For the competitive schools, this scenario will almost certainly play out. The common misunderstanding is that they are out of luck.
I can see where this misunderstanding came from. The paper written by the economists who invented the algorithm states: “When all of its seats are tentatively assigned, it rejects all the proposers who remain unassigned.” Professor Roth confirmed for me that the algorithm does not stop processing the remaining first choices of the students. So the lottery analogy is incorrect. In fact, the order by which the algorithm processes the students is irrelevant. As far as the algorithm is concerned, there is no luck involved, although there are many factors outside of it that involve luck.
If you want to understand how the algorithm works, this video is the best explanation I’ve come across so far. Even though this is for matching hospitals, the basic principle of “deferred acceptance algorithm” is the same. Here is a shorter paper on the same topic.
Rather than a lottery, it works more like the game of poker where the dealer keeps dealing cards to schools until he goes through the entire deck. So, as a school, you would keep replacing the lower ranking cards with the higher ones. At the end of the whole stack, you would have the best possible combination of cards.
But, here is where this algorithm is unique. It’s called “deferred acceptance algorithm” so whatever the cards that each school holds at the end of the whole stack of cards is not the final choices because the algorithm has so far dealt only the first choices of the students. It will continue to process all 12 choices as if there are 12 stacks of cards. In the second stack, if the school finds better students, they will continue to replace the lower ranking ones with the higher ones.
This algorithm has nothing random about it. There is no luck involved. But many parents and students are baffled by the results anyway because luck is indeed involved in the ranking criteria used by each school. Because most schools take into account multiple criteria, you have no way of knowing where your child ranks. Even if her grades are high, she may be eliminated by other criteria like attendance or lateness. Some schools do not rank students at all and select them randomly. And, some schools put a lot of weight on interviewing, which is almost entirely subjective, so, for all intents and purposes, they are random.
Because the ranking algorithm is different for each school, it’s important that the 12 schools you choose have enough variety in the ranking algorithms. At least some of them should have objective ranking criteria and you should meet those criteria comfortably.
What I have described above may scare some of you but I need to remind you that New York City high schools are not actually competitive. Even those that are considered “competitive” would be average by the suburban standards.
New York Times recently published an article entitled “Couldn’t Get Into Yale? 10 New York City High Schools Are More Selective.” This article is comparing apples to oranges. They are using “applicants per seat” as a measure of competitiveness, but this is entirely misguided. You can ignore applicants per seat. It’s a meaningless metric.
Since the students are strongly encouraged to fill in all 12 schools in the application form, there is nothing to lose by including many of the top schools even if you have little to no chance of getting in. Some schools do not require you to do anything other than to apply. No tests, interviews, auditions, portfolios, sign-ins at the high school fair, or essays. With such little effort required to apply, people will naturally add them in the list of 12 schools, which explains why some schools have a large number of applicants per seats. This cannot be compared to the applicants per seat of Ivy League schools where the majority of applicants actually qualify.
With the deferred acceptance algorithm, you’d be a fool not to list the top schools regardless of your chances. Some people worry that they should not waste their first choice on a pipe dream, but such concern is unwarranted. Your first choice has no more weight than your 12th choice. It’s perfectly fine to put your pipe dream in your first choice as long as you have realistic choices also included in the 12. However, you should make sure that they are ordered according to your true preference just in case your pipe dream comes true.
Again, at the end of the day, the vast majority of New York City schools are not competitive. It’s just that your probability of getting your first choice isn’t very high. That’s because of the random factors of each school’s selection criteria. Beacon, for instance, is listed as one of the most “competitive” schools in the Times article but, for all intents and purposes, their selection criteria is random because it’s subjective. Getting accepted does not mean you are smart; you were just lucky. Ultimately it comes down to the interviewer liking you enough. And, if you are white, your chances increase dramatically. Calling these schools “competitive” is like calling lottery competitive. The only truly competitive schools are the SHSAT schools which are not even listed in the Times article.
The high school admissions game in New York City is stressful not because the schools are competitive, but because you find the vast majority of them are unacceptable for your child. Because of the racial and cultural segregation, your choices become rather slim. And, because of the random factors in the matching process, you have a significant risk of your child going to a school where he would feel like a foreigner, where your voice as a parent would be ignored. That is the fear. The fact that there are nearly 500 high schools in New York City cannot address this problem because we have created our own small bubbles in order to escape diversity.
I recently came across this quote by Alexis de Tocqueville written in 1840:
So the Negro [in the North] is free, but he cannot share the rights, pleasures, labors, griefs, or even the tomb of him whose equal he has been declared; there is nowhere where he can meet him, neither in life nor in death. ... In the South, where slavery still exists, less trouble is taken to keep the Negro apart: they sometimes share the labors and the pleasures of the white men; people are prepared to mix with them to some extent; legislation is more harsh against them, but customs are more tolerant and gentle.
This is still true today to some extent.
A glass-half-full way of looking at the high school admissions game is that whatever random school your child is matched with, can be a great learning experience. Say your child is white, black, or Hispanic, and he is matched with a predominantly Chinese school like High School for Dual Language and Asian Studies where most of the students speak Chinese to each other, where you and your child would feel like a foreigner. If you are white, you might learn what it’s like to be a minority. Whether you think of this as a disaster or as a benefit of living in a diverse city like New York, would reveal what you truly think of diversity.
Related posts:
Subscribe
I will email you when I post a new article.
