Graph of Fame - Weblog Popularity
TruthLaidBear.com provides an interesting snapshot of how Internet traffic is distributed among Weblogs. Website traffic is a closely guarded secret for most businesses, and no one has an accurate picture of how Internet traffic is distributed. Only the site owners with access to the Web server logs have the truth of the traffic they receive, but since they do not have access to the logs of their competitors, they do not know how their numbers stack up against others. The number alone with nothing to compare against is just an arbitrary number, and means very little. What you want to know is where you are in the spectrum of popularity. Are you a nobody, an average Joe, or a superstar?

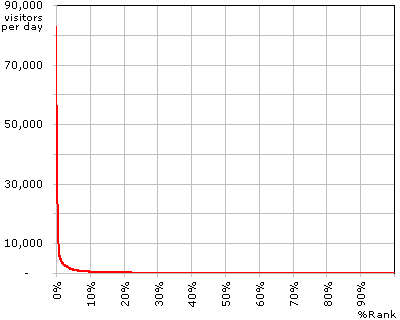
Graph A
Graph A above is based on the data provided by TruthLaidBear.com. The X-axis is the percentile of popularity. A superstar would be towards 0%, a nobody would be towards 100%, and an average Joe would be near 50%. It is based on a sample of 1,300 Weblogs. The 650th Weblog would be exactly at the 50% point. The Y-axis is the average number of visitors they receive each day drawn on a linear scale. As of today, the number 1 Weblog site, InstaPundit.com, receives 82,934 visitors a day on the average. The average Joe, the 650th Weblog, receives 45 visitors a day. And, the most unpopular Weblog receives 1 visitor a day.
The first thing you notice about this graph is that it is highly exponential. The graph is almost useless because it hugs the axes so closely. Compared to the popularity of the top 1 percentile, the difference between the top 2 percentile and the very bottom percentile is negligible. In order to make the graph more useful, here is another one on a logarithmic scale.

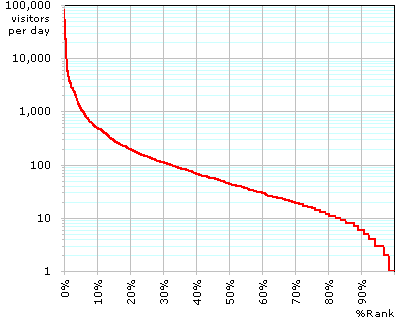
Graph B
In this one, you can see the number of visitors better for the majority of the sites. If you know the number of visitors you receive, look it up on the Y-axis, and travel to the right to find the percentile you belong to.
According to this graph, 90% of Websites receives somewhere between 1 and 490 visitors a day. Most sites hosted by the company I work for, belong in this range. According to FastStats Analyzer, this very site (DYSKE.COM) received an average of 418 visitors a day in the past 30 days. According to Webalizer, it is 257 visitors. Unfortunately the interpretation of “visitors” varies greatly depending on the analysis program, but let’s just take somewhere in the middle and say I received 337 visitors a day on the average. That places me in the top 14 percentile.
Even though this graph is for a specific type of Website, the curvature (distribution) of the graph should be reflective of the whole of the Internet. It is equivalent to drawing a graph of name recognition in a single industry. Say, we randomly sample names of 1,000 professional writers. We then have a few hundred people read through the list of names and mark the names they recognize. You sort the writers by how many people recognized their names, and draw a graph similar to the one above. The curvature you get would probably be very similar to Graph A, which means that this is how popularity or fame in general is distributed among us.

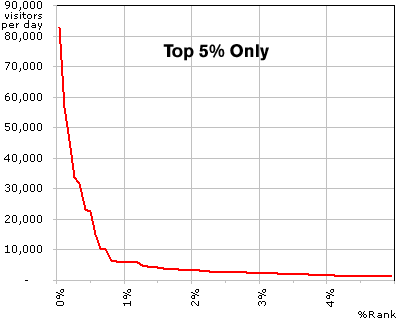
Graph C
Graph C is a close-up of graph A. You are only seeing the top 5 percentile. The highly exponential nature of fame is clearly illustrated in this graph. Once you reach the top 1 percentile, your popularity zooms up tremendously. Everyone else pales in comparison. It shows that the snowballing effect of fame really kicks in at the top 1 percentile. Fame breeds fame. You become famous simply because you are famous. You would want to check out InstaPundit.com, the most popular Weblog, simply because it is the most popular one, if for no other reason.
I would imagine that this curvature (distribution) hardly ever changes. If we could assume this, we can conclude that there are only so many people who can actually become famous. It is a zero-sum game where one person gaining fame means another person losing it. I wonder what percentile you have to be in order to be a household name. I would imagine that it would be a very small area at the top. It would have to be above 0.08 percentile, the percentile of InstaPundit.com, since InstaPundit is not a household name.
Addendum (10/9/03):
This makes intuitive sense. How often do we run into someone who has a household name? Even if you took a sample of 10,000 random names from the Social Security database, the chance of one of them being a household name would be still quite slim, which means that, to be a household name, you have to be above a 0.01 percentile. In the same way, take a sample of 10,000 websites randomly; the chance of one of them being a site like Yahoo or Google would be slim to none, because there are so many unpopular sites out there.
If the world contained only 10 people, everyone would be famous, because everyone in the world would know who you are. Increase that to 100; the same would probably still hold. But, once you go beyond 1,000, there would probably be people you have never heard of. I think there is a fixed number of people who can be famous due to the way our memory works. At any given moment, most of us can recall only a handful of phone numbers. Similarly, the number of URLs we can memorize is also limited. Whether there are 100 thousand or 100 billion people in the world, makes no difference to how many people can remain in our immediate memory, that is, be famous. This in turn means that the larger the population, the more extreme the graph of fame would be, and the more powerful each famous person would be. If we were capable of remembering 1 million URLs, this would not be the case.
Even though it is difficult to imagine a world where there are only 100 people, we could imagine when the Web first started, when there were only 100 websites. All websites then probably received similar numbers of hits. The curve must have been quite flat. For instance, the top site getting 10 visitors a day, while the bottom site getting 5. As the number of websites increased, the more extreme the curve became.
Since the number of websites with household recognition is limited, the larger the audience becomes, the larger the gap becomes between top sites and ordinary sites in terms of traffic. Once the population of the Internet grows to a certain level, the overall curvature (distribution) of the graph will probably remain virtually unchanged.
Subscribe
I will email you when I post a new article.


