How Stress on Healthcare System Affects Death Rate
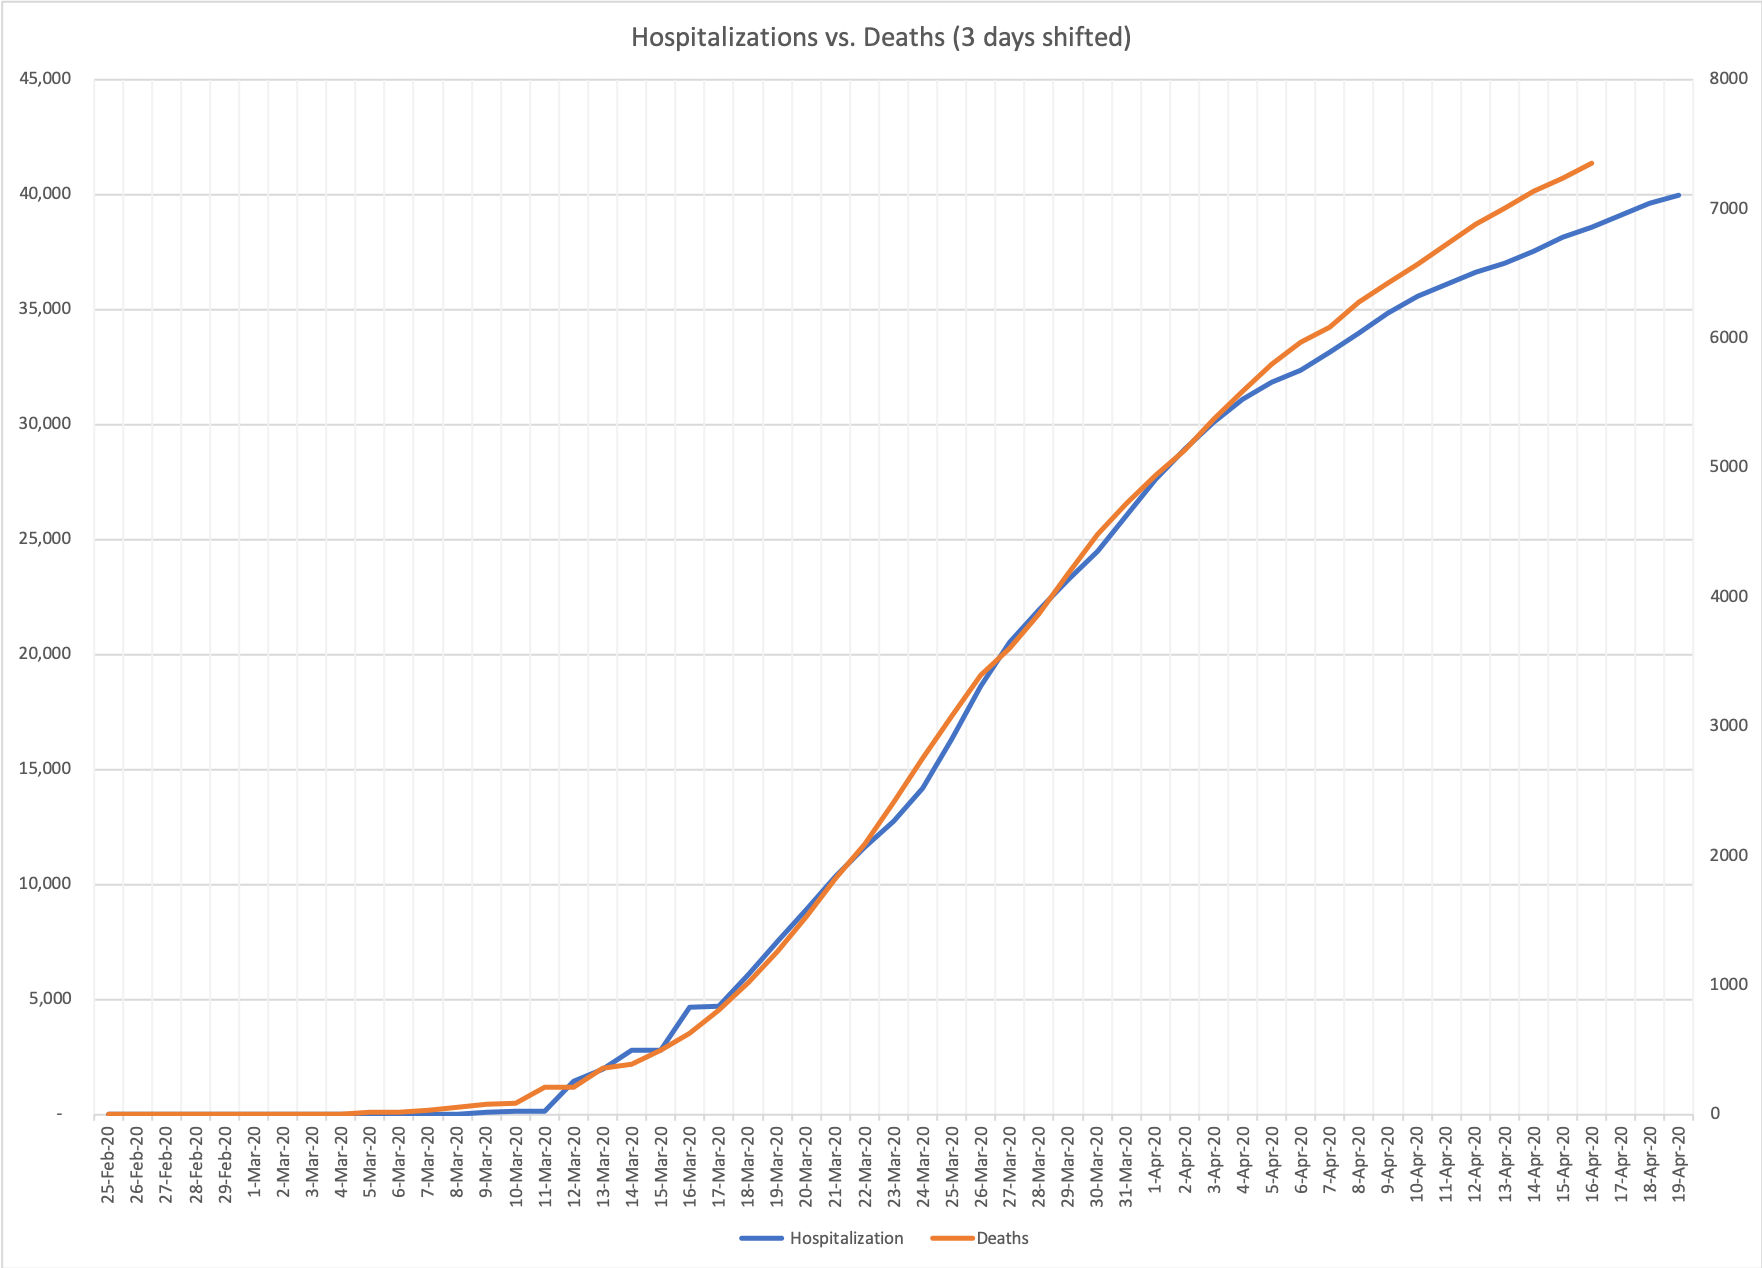
To determine the effect of over-crowding healthcare system, I looked at Madrid’s data. I picked a city instead of a country because the latter would dilute the effect. The data available for Spain had the numbers for currently hospitalized patients which declined over time, so I added back the numbers of “recovered” to arrive at the cumulative numbers. Because death happens some days after hospitalization, in order to see the delay, I charted the two series on their own Y-axis. Here is the chart that compares hospitalizations and deaths:
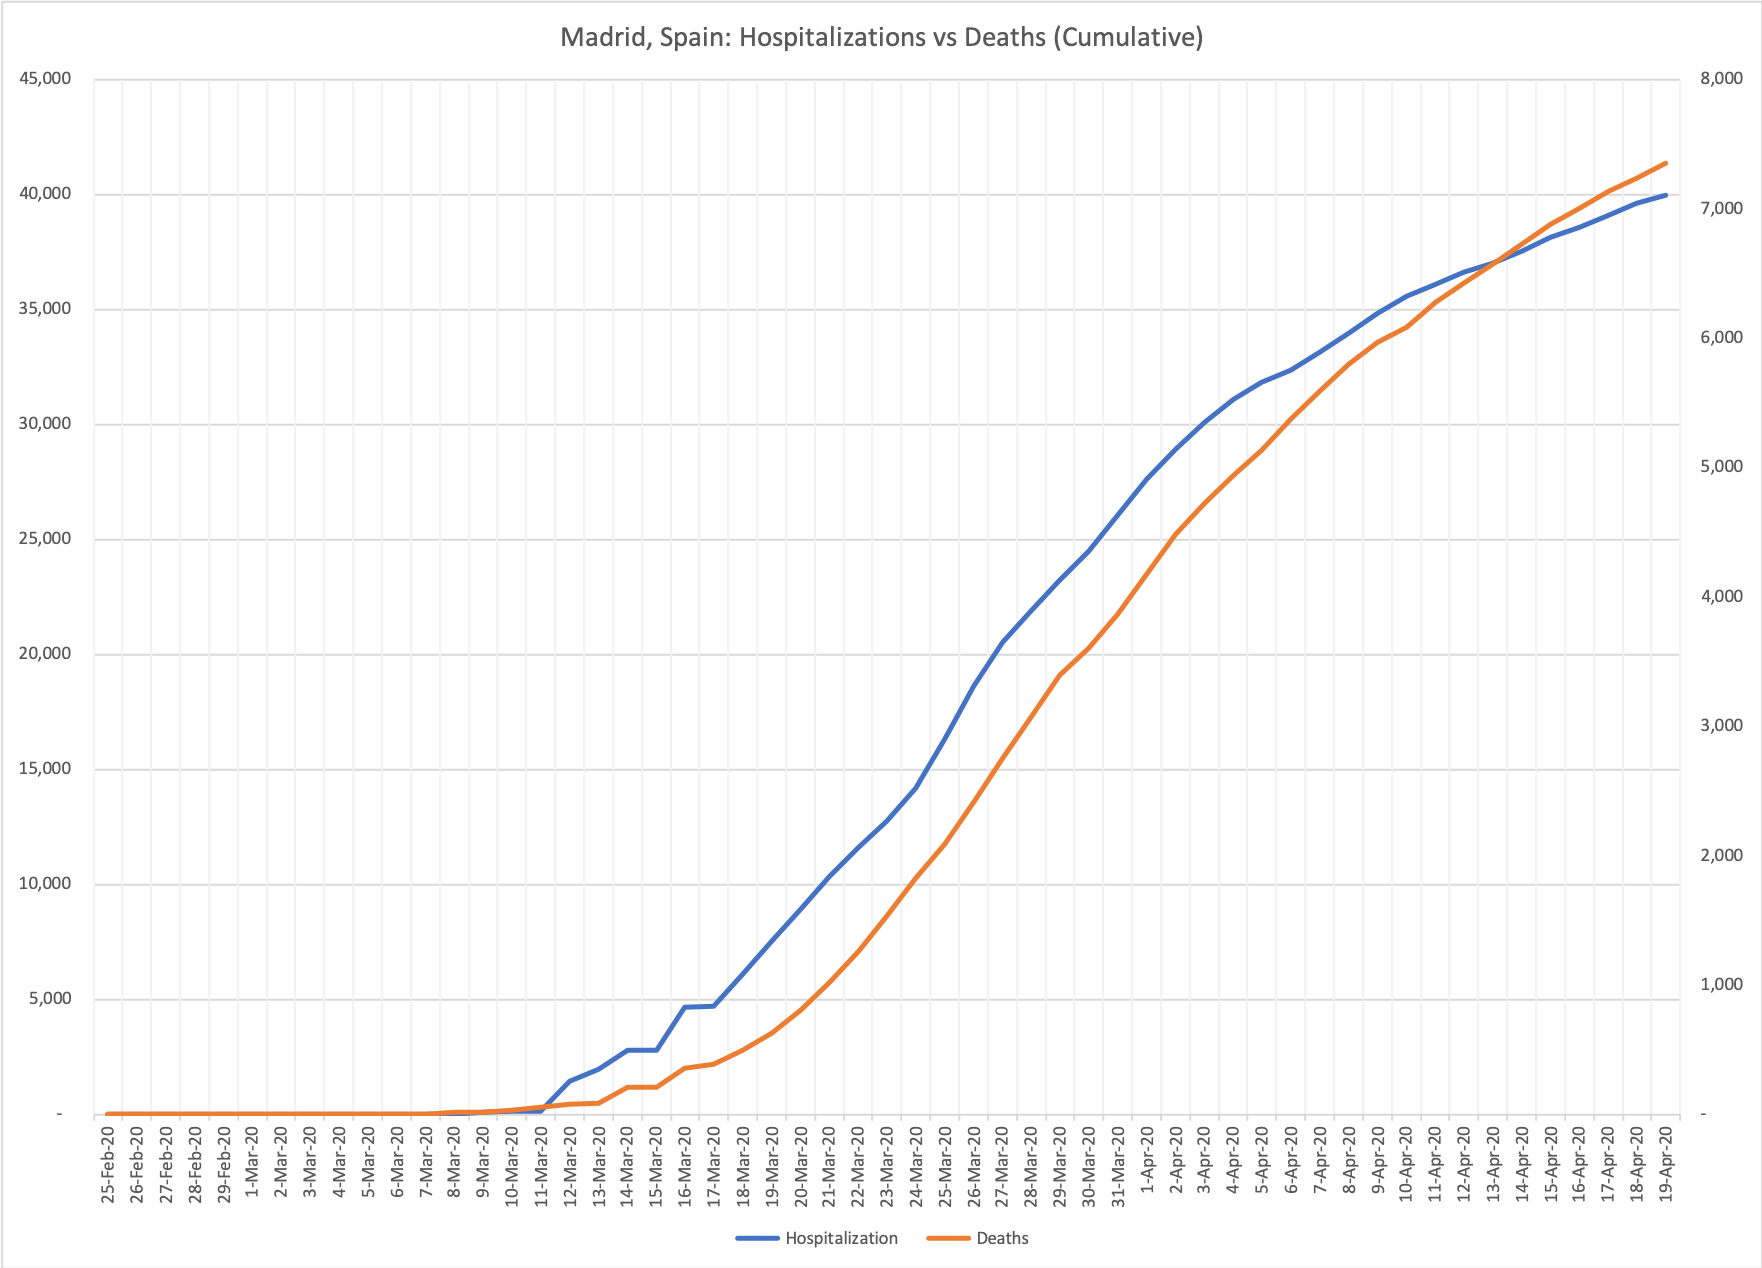
You see the delay is about 3 days. I also charted the confirmed cases against deaths, and here is what I got:
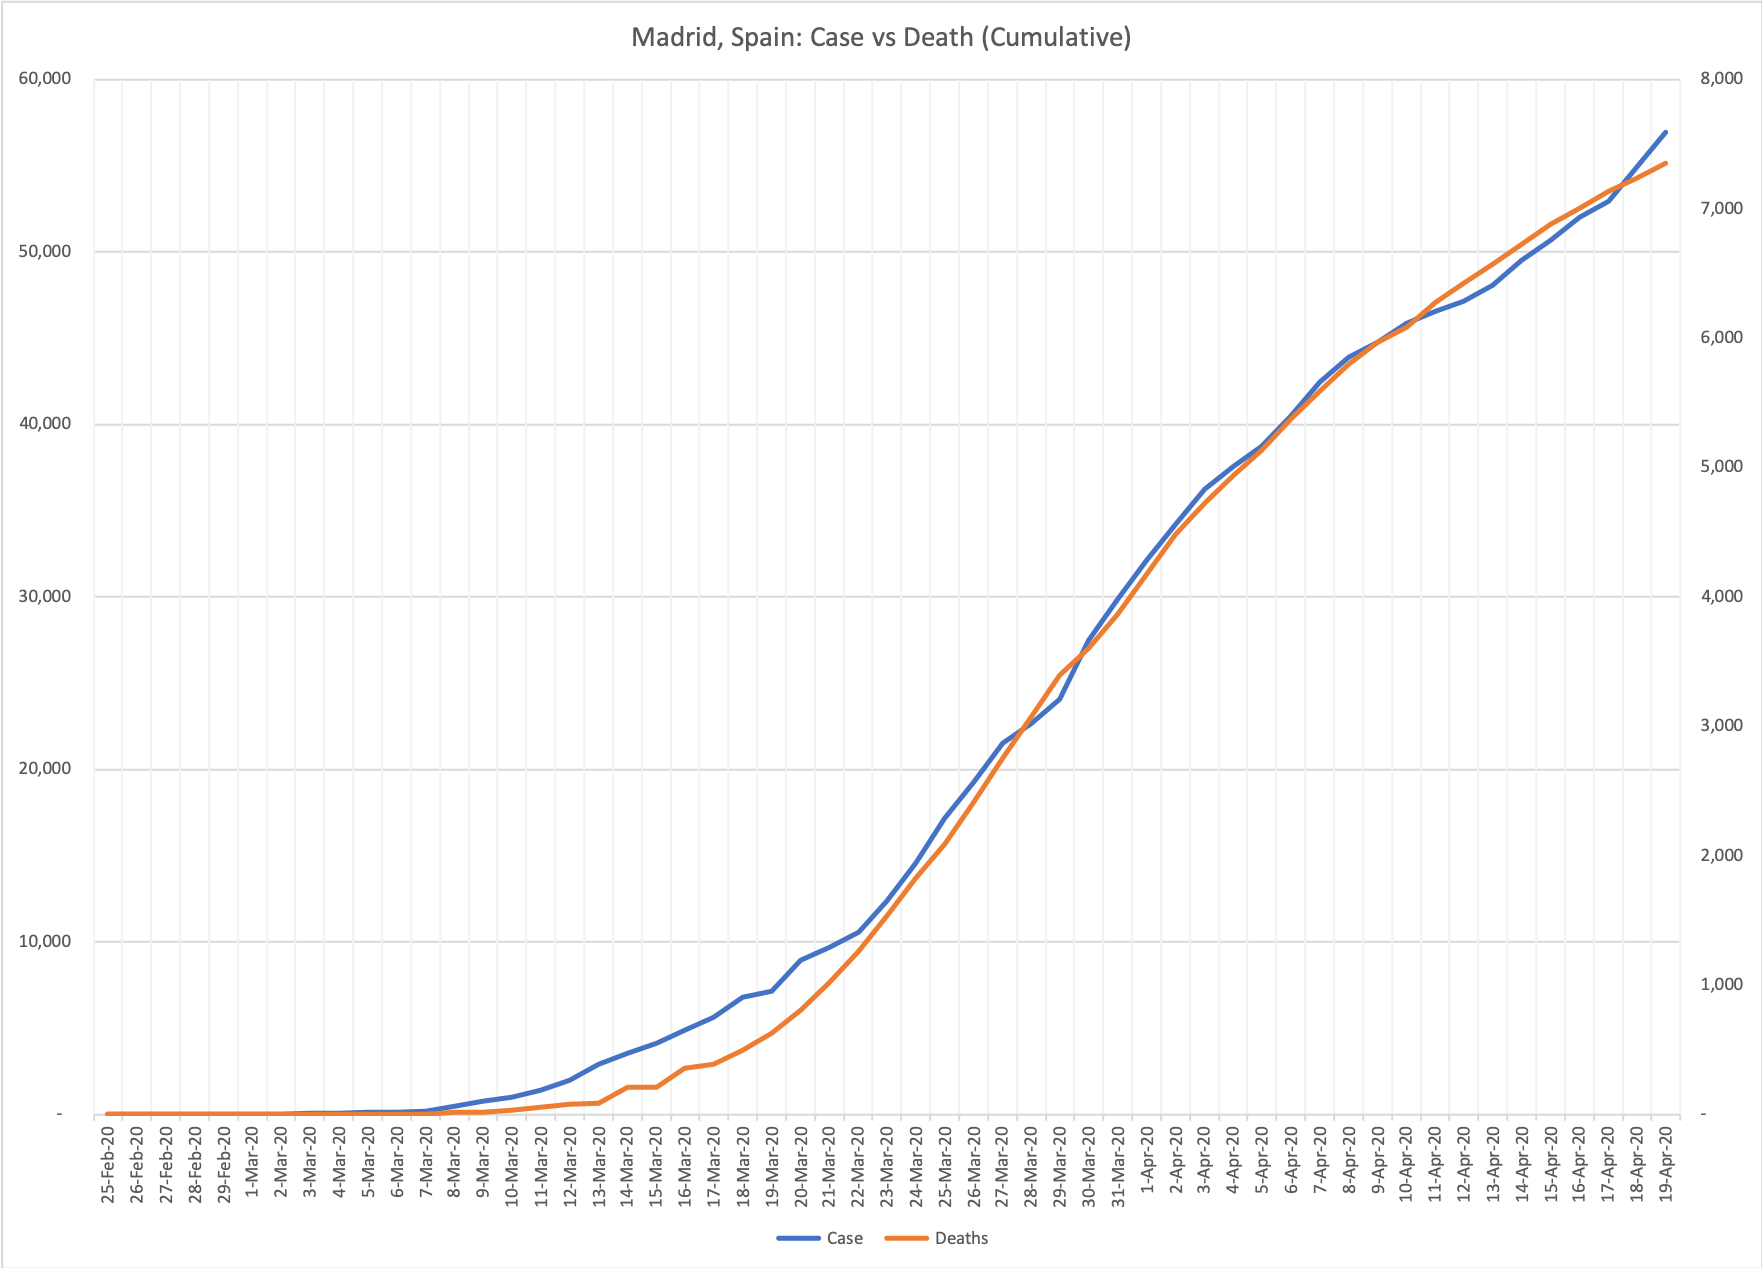
Interestingly, they line up. Because most of the confirmed cases do not end up in hospitals, we ignore this. I shifted the curve for deaths by 3 days in order to line them up. Here is the result:
Finally, I look at the ratio of death and hospitalization:
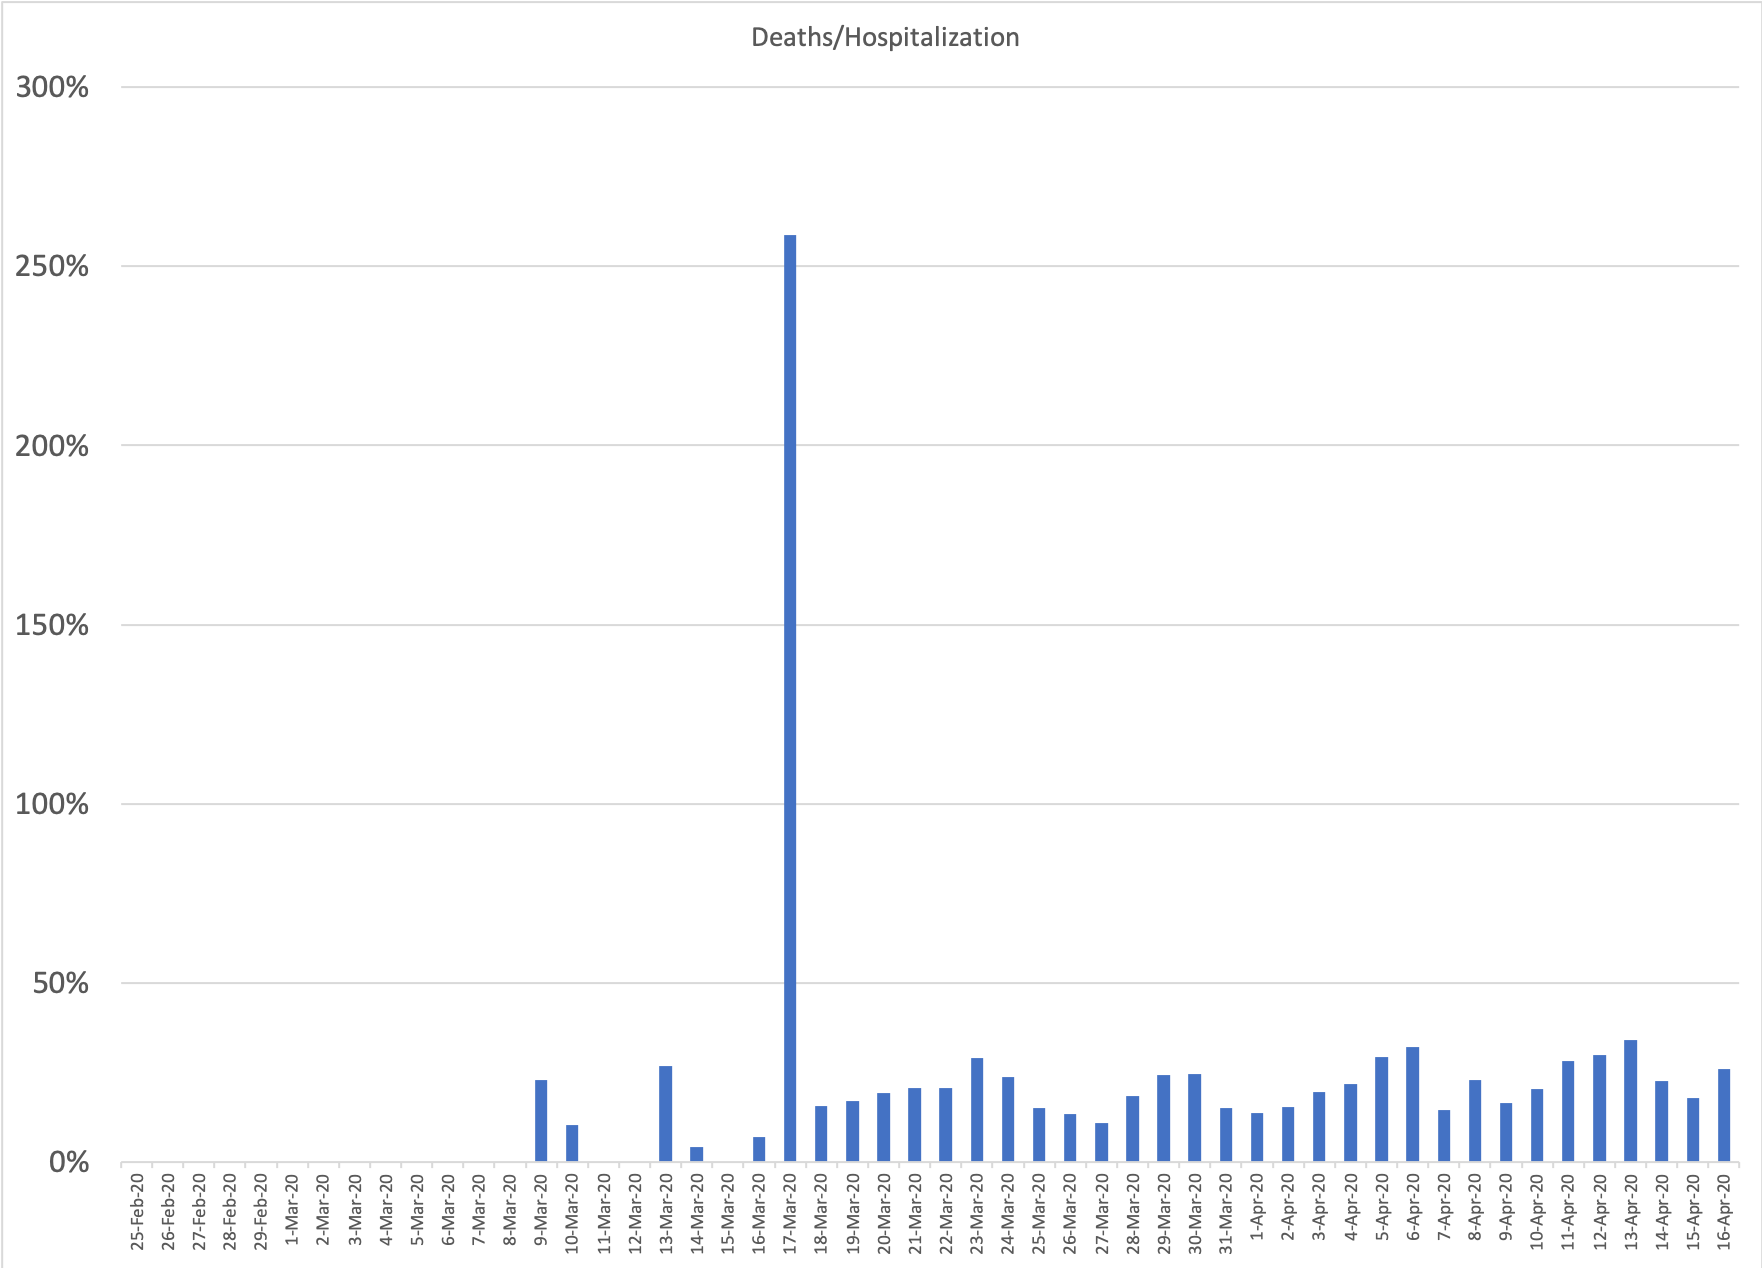
The beginning is noisy, probably because they weren’t collecting the data consistently at the beginning. So, we get rid of the noisy area and plot the rest:
The trendline indicates that, over this specific period, the ratio increased from 17.5% to 25%, an increase of 7.5%.
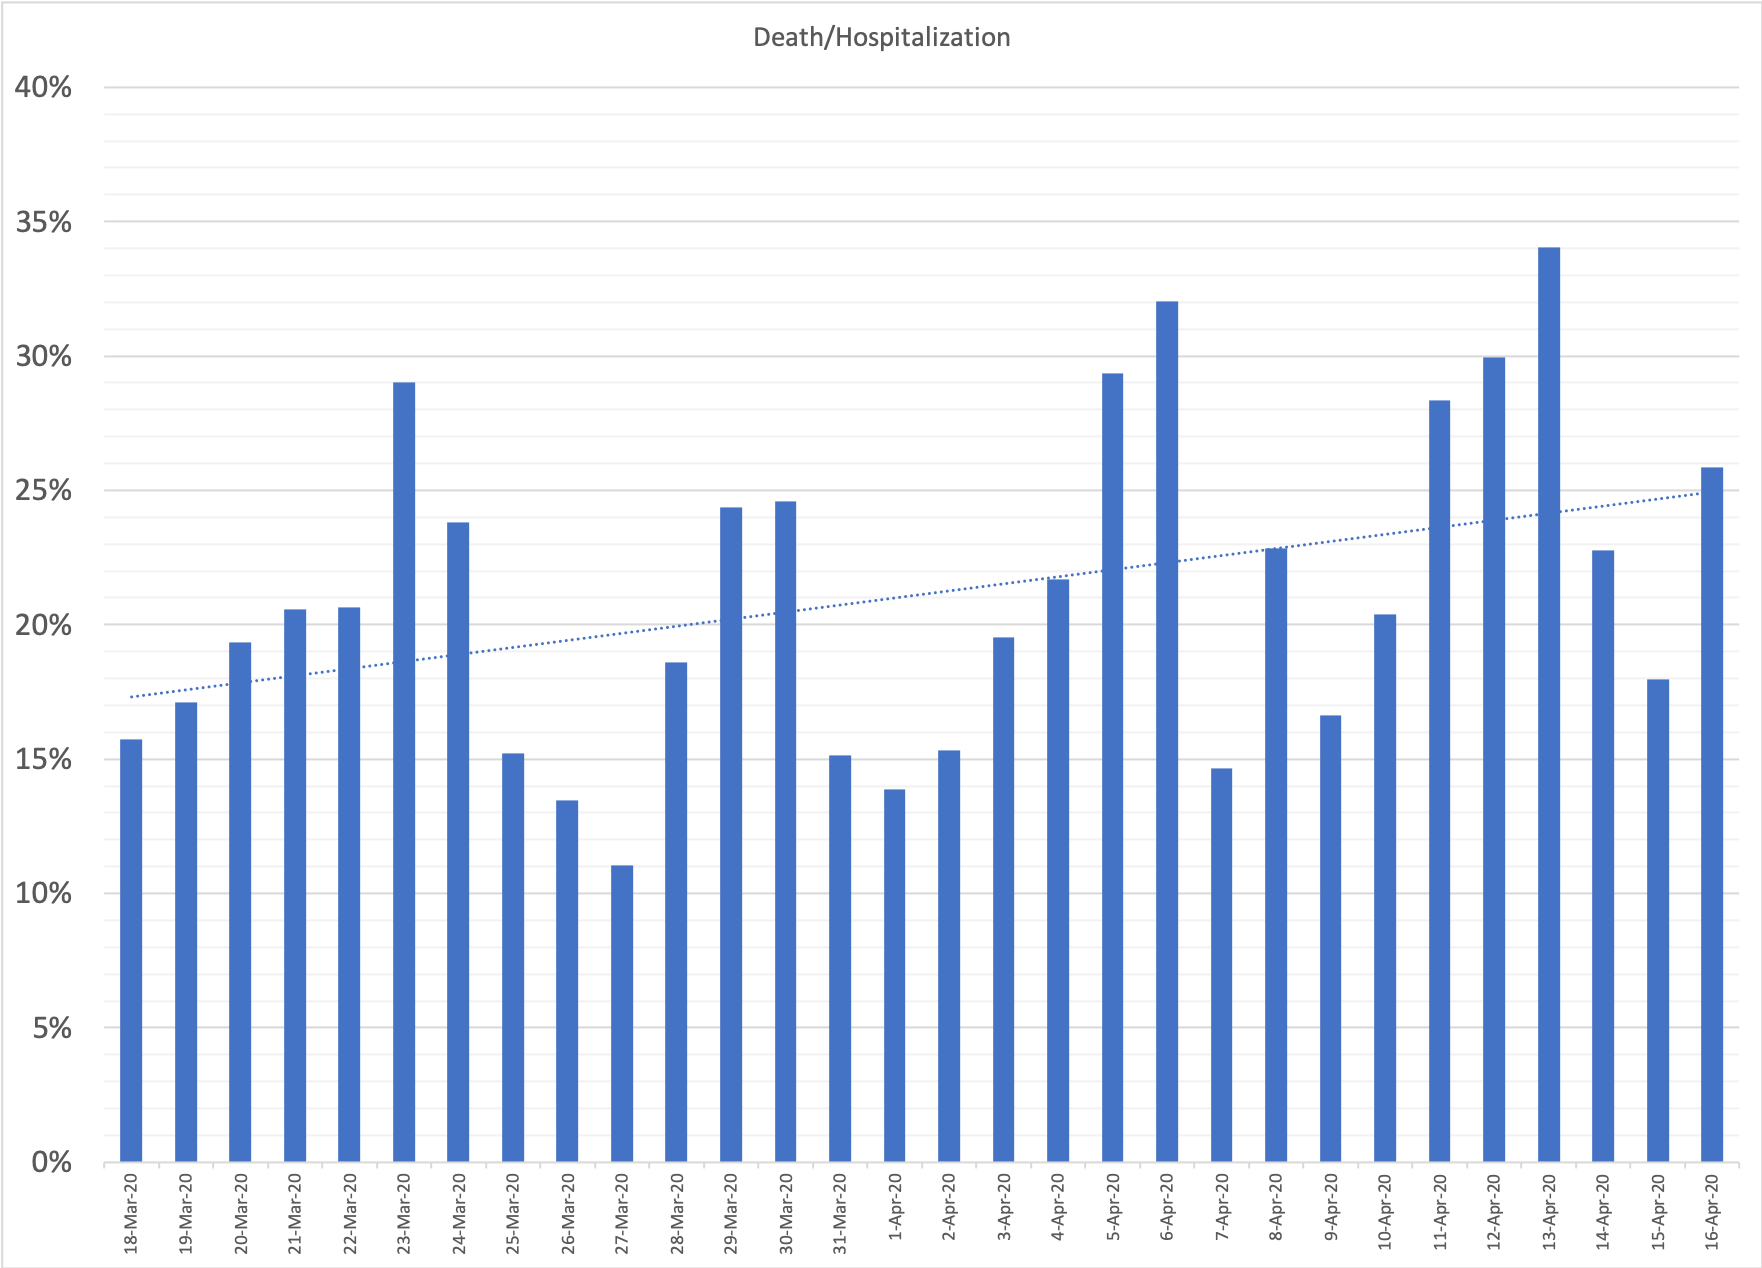
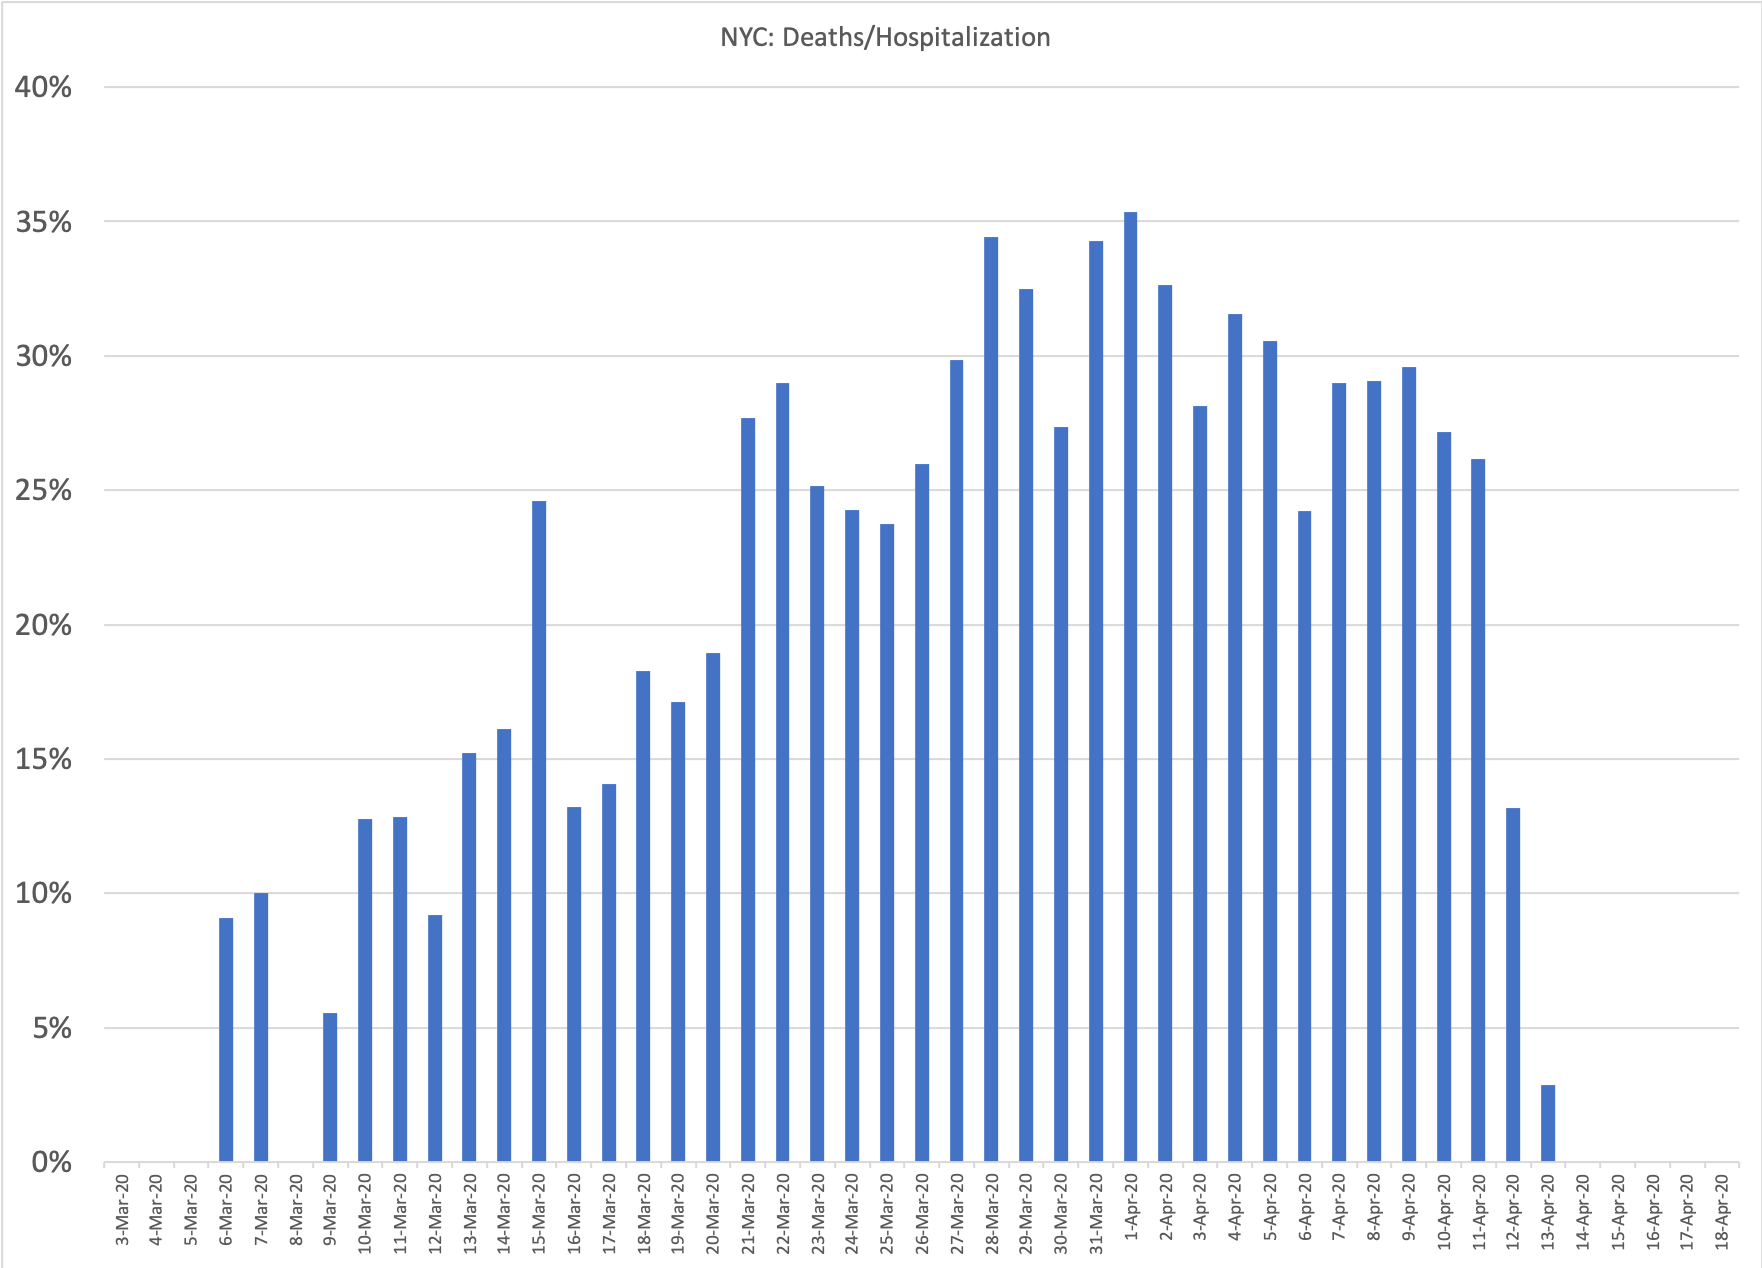
Now we do the same thing to New York City (not state)
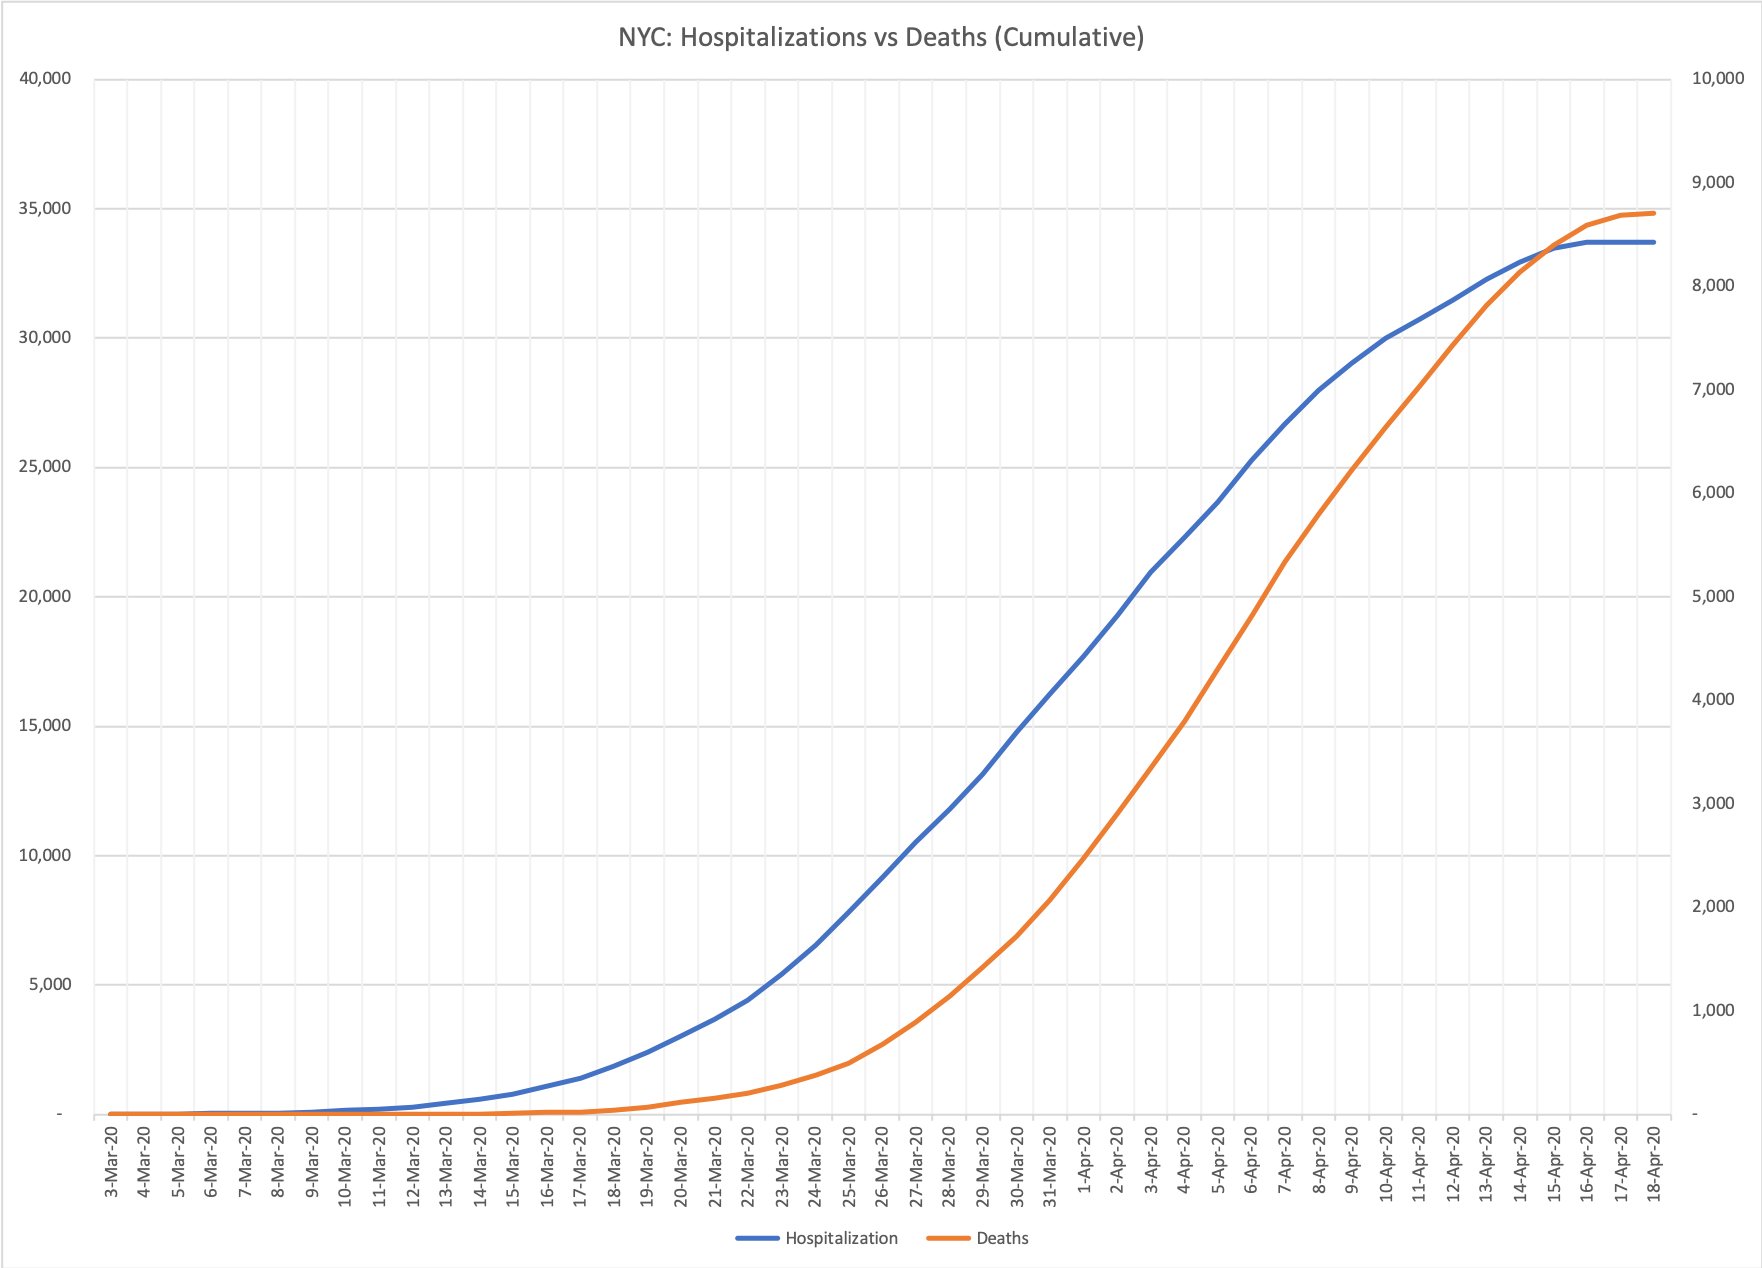
The delay for NYC is roughly 5 days, but we can see that the lag gets narrower over time. In March, it was 6 days and in April, 3 days.
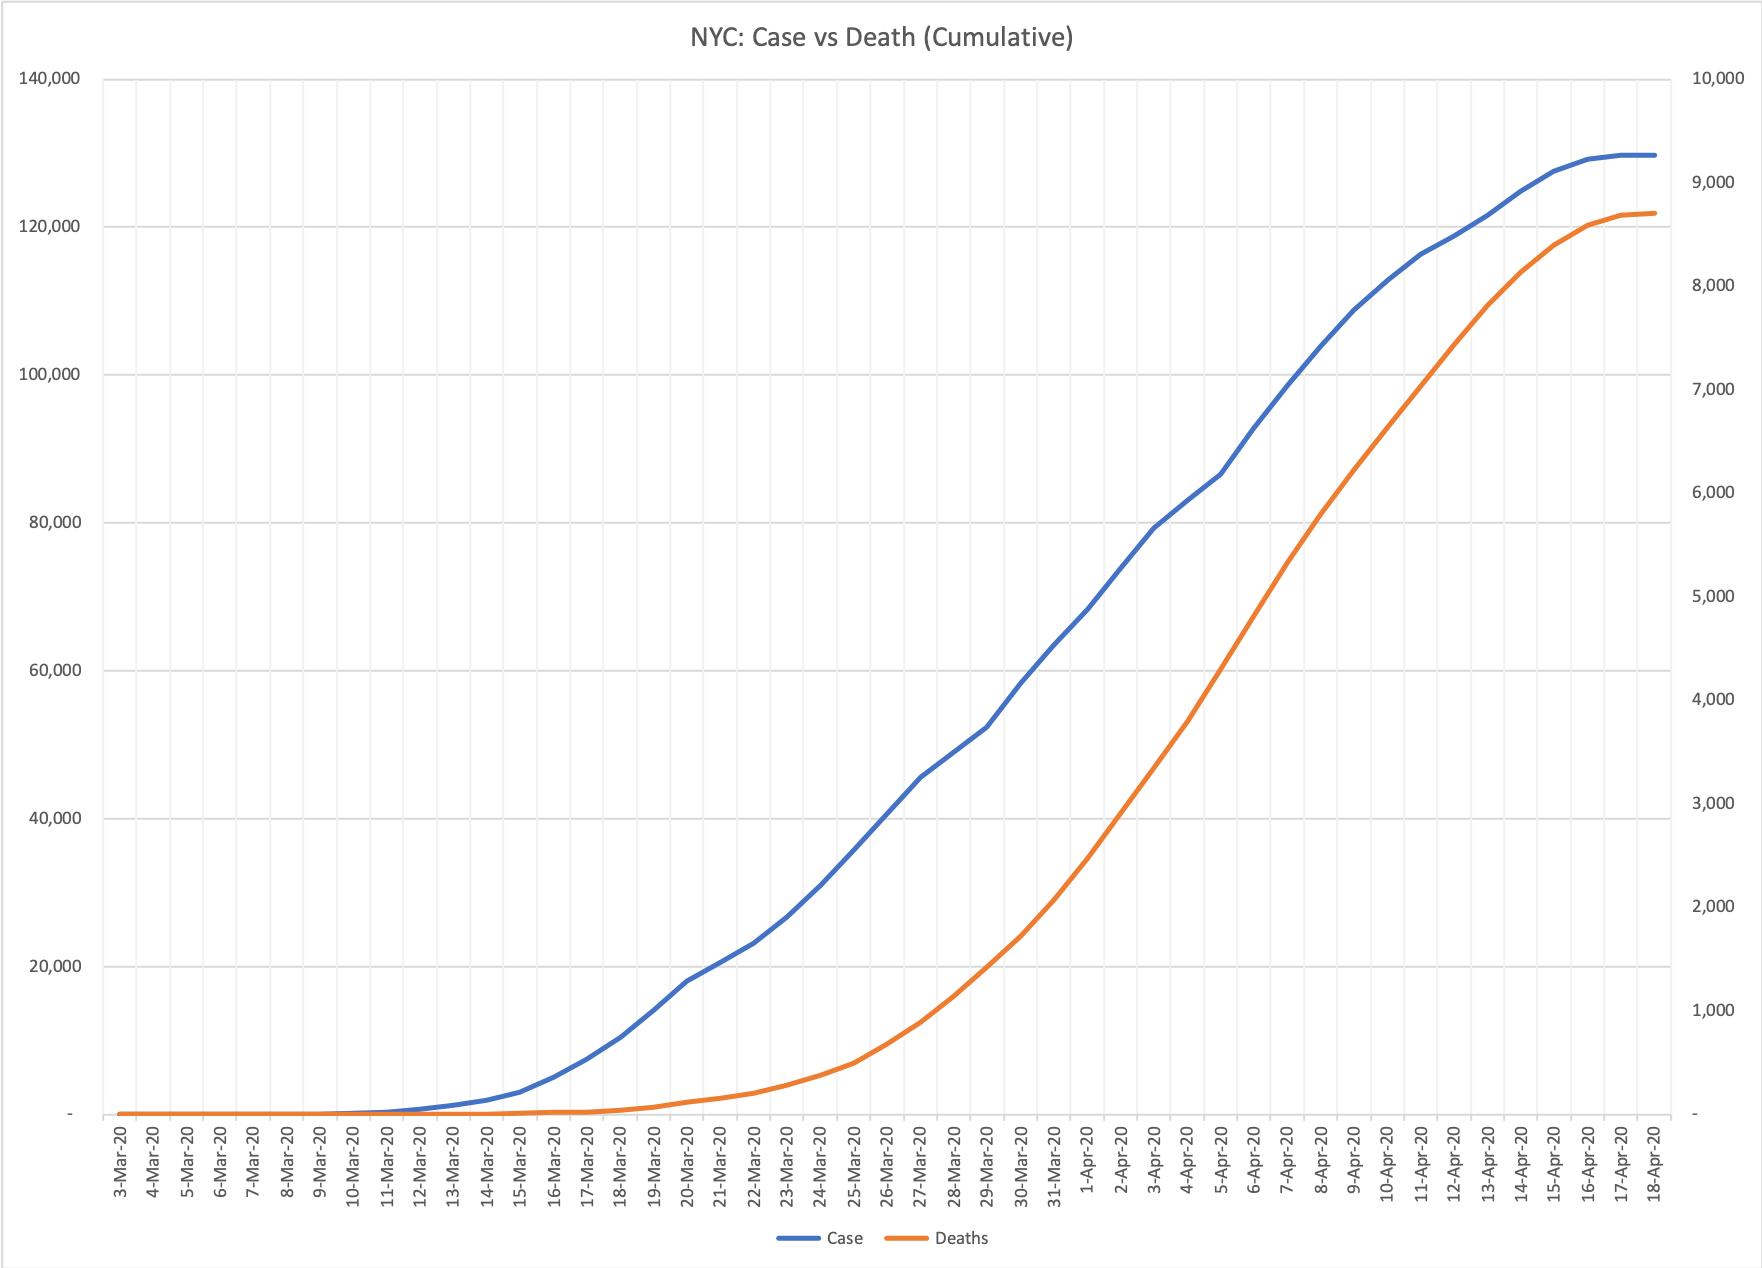
The lag between confirmed cases and deaths is larger, roughly 7 days. (Not sure why the lag for Madrid is zero.) We now shift NYC by 5 days.
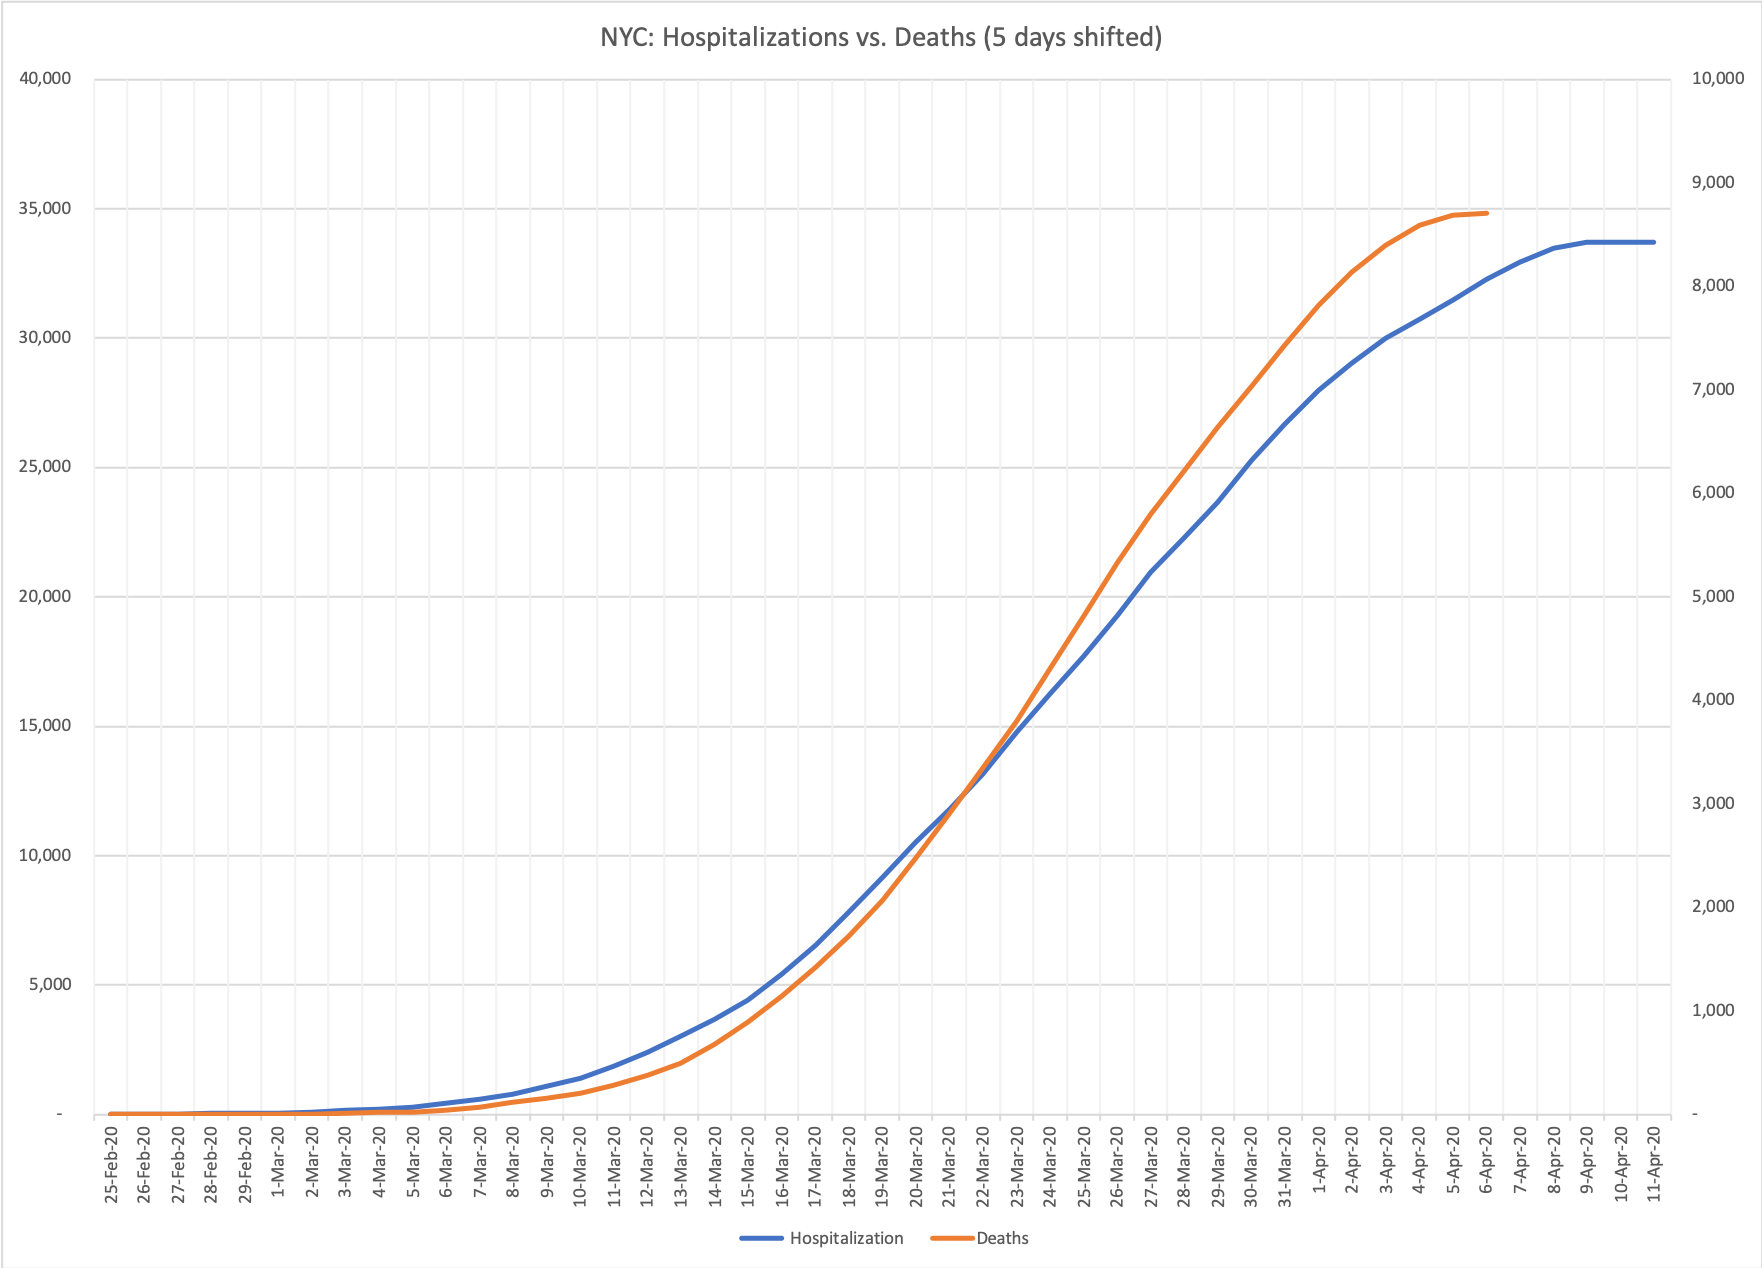
The data for recent days are incomplete for NYC, so we crop them off. We also crop off the beginning days as we did for Madrid.
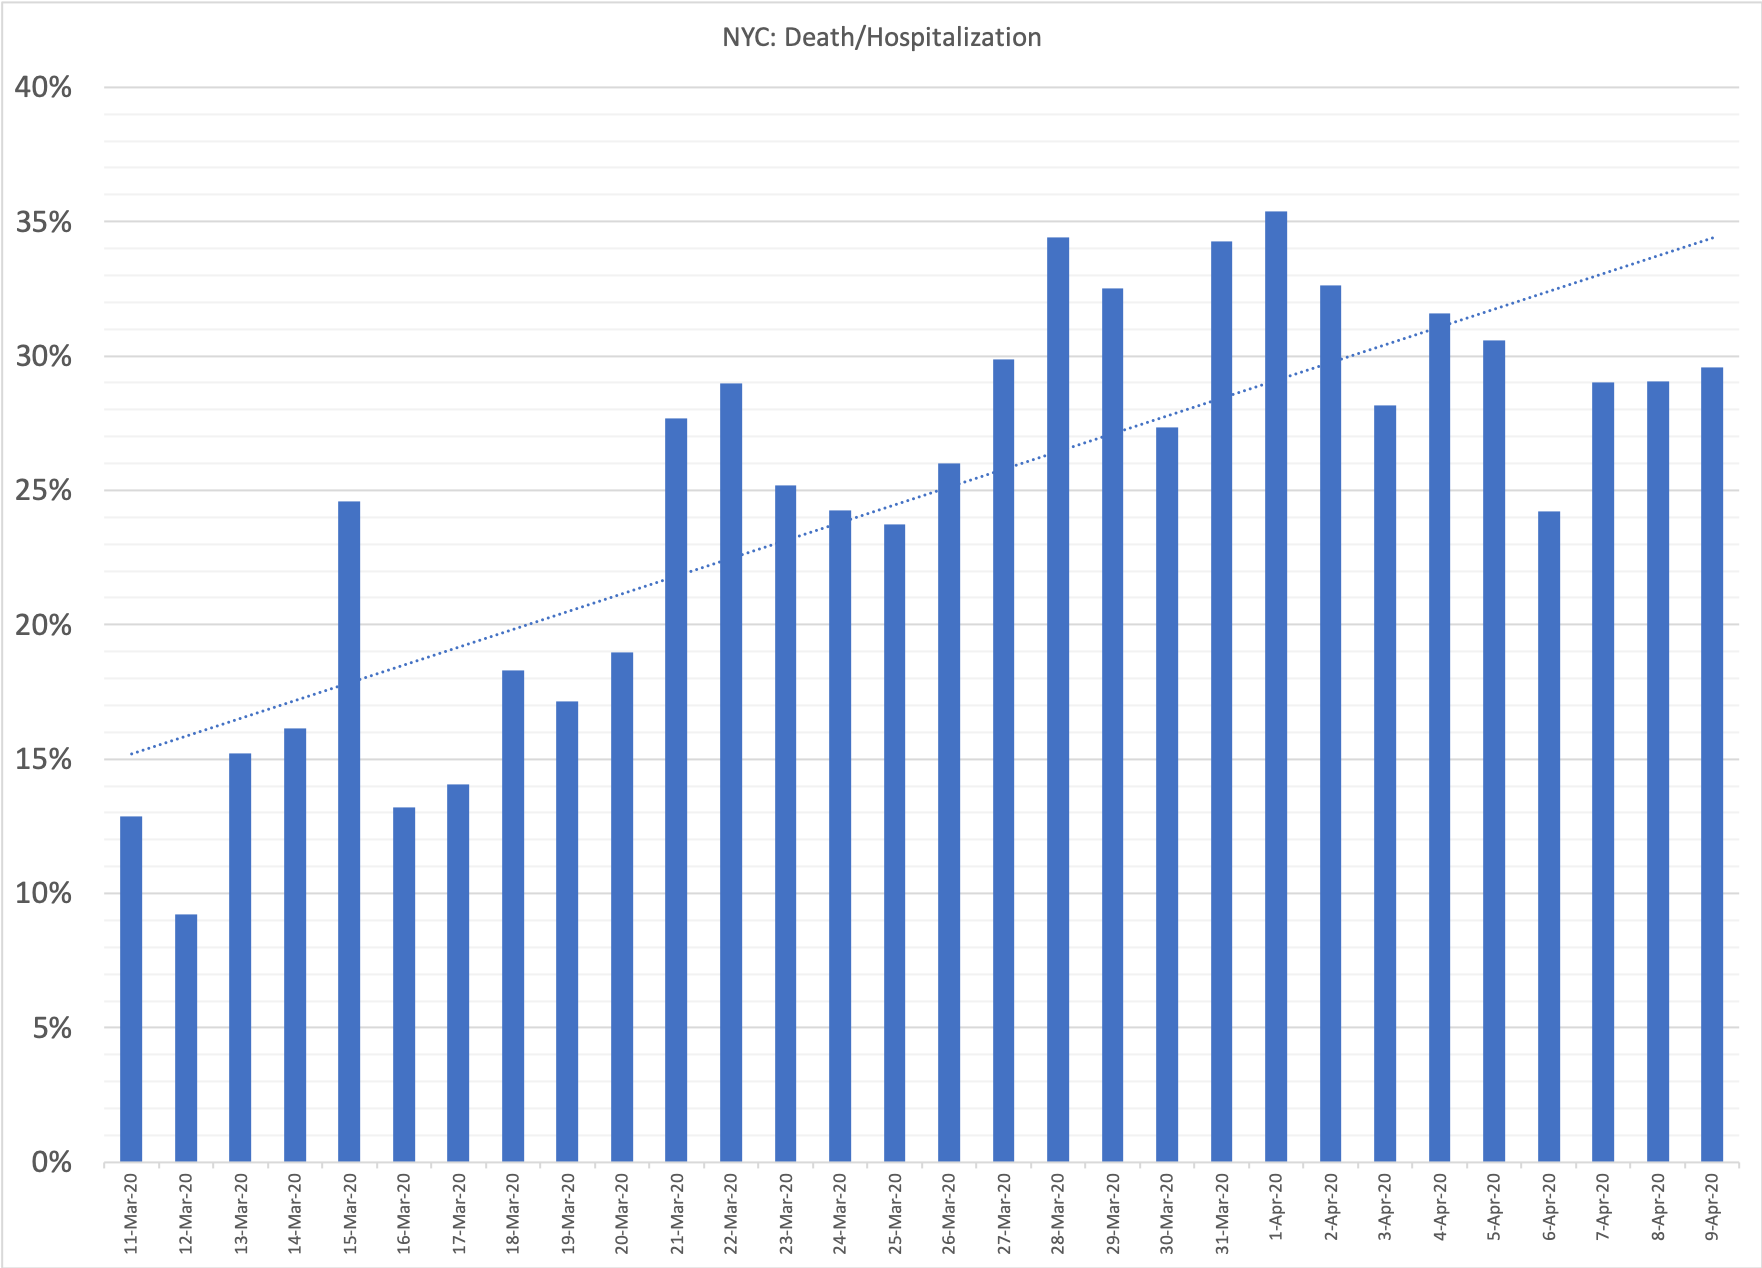
The trend line goes from 15% to 34.5%—an increase of 19.5%
Subscribe
I will email you when I post a new article.

